Device Summary - New UI
SECURITY Refer to SITES > Devices in Security Level Details - Permissions.
SECURITY For the Create a Maintenance Mode Window action button and the Monitors card, also refer to SITES > Monitor in Security Level Details - Permissions.
SECURITY For the Request Audit button, also refer to SITES > Audit in Security Level Details - Permissions.
SECURITY For some action buttons, the respective remote control tool must be turned ON in Security Level Details - Remote Control Tools.
NAVIGATION New UI > Devices > All > click the name of a device
NAVIGATION New UI > Devices > click the name of any of the previously accessed devices
NAVIGATION New UI > Dashboards > select a dashboard > click the name of a device in any of the widgets
Device name, icons
The Device Summary page provides easy navigation to locate all relevant information about a device efficiently. It is touchscreen friendly and offers visual cues on a single, intuitive page to guide you to the information you need the most.
You may see the following visual indicators next to the device name: 
-
The device is online (green circle) or offline (transparent circle).
-
The operating system of the device when the information is available.
-
The device has Privacy Mode enabled.
-
The device is in maintenance mode.
Action buttons
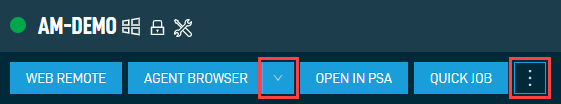
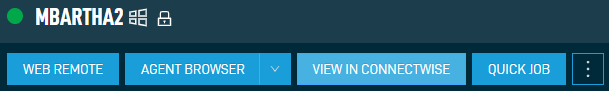

Different device types have different action buttons displayed at the top of the page. To access all action buttons, you may need to click the Device Actions icon at the end of the row or hover over the V icon next to the Agent Browser button. The table below lists the available action buttons per device type. Further down, you will find information about each action button.
| Action Button | Server/Laptop/Desktop | Network Device | Printer | Datto Networking | Datto Continuity | ESXi | ||||
|---|---|---|---|---|---|---|---|---|---|---|
| Access Point | Switch | Managed Power | ALTO | SIRIS | vSIRIS | |||||
| Web Remote |

|
|||||||||
| Agent Browser |
|
|
|
|
||||||
| RDP | From Windows to Windows | |||||||||
| Splashtop | From Windows and macOS to Windows and macOS | |||||||||
| PowerShell | From Windows to Windows | |||||||||
| Open in PSA |

|
|
|
|
|
|
|
|||
| View in ConnectWise |
|
|
|
|
|
|
|
|||
| Quick Job |
|
|||||||||
| Move to Another Site |
|
|
|
|
||||||
| Create a Maintenance Mode Window |

|
|
|
|
|
|
|
|||
| Create a Job |
|
|||||||||
| Request Audit |
|
|
|
|
||||||
| Create Ticket |
|
|
|
|
||||||
| Delete |
|
|
|
|
||||||
| Create a Device Group |
|
|
|
|
|
|
|
|
|
|
| Add to Existing Device Group |
|
|
|
|
|
|
|
|
|
|
| Remove from Existing Device Group |
|
|
|
|
|
|
|
|
|
|
| Copy Device Information to Clipboard |
|
|
|
|
|
|
|
|||
| Reboot |
|
|
|
|||||||
| Network Manager |
|
|
|
|||||||
| Connect |
|
|
|
|||||||
| Open in Portal |
|
|
|
|||||||
| Recovery Launchpad |
|
|
|
|||||||
Only displayed for online devices and if the Web Remote option is turned ON in the Remote Control Tools section of your security level. Click the button to connect to the device using a Web Remote session. The session will open in a new browser tab.
IMPORTANT Web Remote sessions can be initiated from Windows, macOS, Linux, iOS, or Android devices using a recent version of the Chrome, Firefox, Edge, or Safari browser; no installed Agent is required. However, only Windows and macOS devices with an Agent installed can be controlled via a Web Remote session.
For Web Remote to function properly on macOS devices running Mojave or later, these applications must be listed and checked under System Preferences > Security & Privacy > Privacy in the following sections :
• Screen Recording: AEM Agent, Vine Server
• Accessibility: AEM Agent, Vine Server
• Full Disk Access: AEM Agent, Vine Server
File Transfer requires the Agent Process to be running using .NET Core.
For more information, refer to Web Remote.
Only displayed for online devices. Click the button to initiate a connection to the device using the Agent Browser. You will automatically be logged in to the Agent Browser. Once you are connected to the device, you will be presented with a list of actions you can perform on it. For further information, refer to Agent Browser tools.
IMPORTANT A connection through the Agent Browser can only be initiated from Windows devices with a Managed Agent installed. OnDemand Agents and operating systems other than Windows do not have an Agent Browser.
Only displayed for online devices and if the PowerShell option is turned ON in the Remote Control Tools section of you security level. Hover over the V icon next to the Agent Browser button and click RDP to connect to the device using RDP. The connection can be initiated from a Windows device to a Windows device.
For more information, refer to RDP.
Only displayed for online devices and if the RDP option is turned ON in the Remote Control Tools section of you security level. Hover over the V icon next to the Agent Browser button and click Splashtop to connect to the device using Splashtop. The connection can be initiated from a Windows or macOS device to a Windows or macOS device.
For more information, refer to Splashtop Remote Screen Share Integration.
Only displayed for online devices and if the PowerShell option is turned ON in the Remote Control Tools section of you security level. Hover over the V icon next to the Agent Browser button and click PowerShell to connect to the device using PowerShell. The connection can be initiated from a Windows device to a Windows device.
For more information, refer to PowerShell.
Only displayed if the Autotask PSA Integration is enabled and the device is synced to PSA. Refer to Autotask PSA Integration.
The tooltip on the button informs you about the Last Autotask Sync Date and the Last Autotask Verify Date. Click the button to access the mapped configuration item in PSA in a new browser tab. If you were already logged in to PSA or single sign-on is configured for you, you will be directed to the Edit configuration page. If you are not logged in to PSA, you will be required to enter your login credentials first. For more information, click the question mark icon in the upper right corner of the Autotask PSA page. You will automatically be directed to the appropriate topic in the Autotask PSA Online Help.
Only displayed if the ConnectWise Manage Integration is enabled and the device is synced to ConnectWise Manage. Refer to ConnectWise Manage Integration.
Click the button to view the device in ConnectWise Manage in a new browser tab. If you were already logged in to ConnectWise, you will be directed to the device's configuration page. If you are not logged in, you will be required to enter your login credentials first.
Click the button to run a quick job against the device. Refer to Quick jobs - New UI.
There are times when you want to free up your Managed licenses as you no longer need to have unattended access to those devices. However, sometimes you need to be getting more regular audit information of certain devices and the ability to run jobs on them, so you would need to move them to a Managed site. You may even want to move a device from one site to another because the device was added to the wrong site.
Switching devices between Managed and OnDemand sites is possible in both directions as long as you have enough free licenses available of whichever site type you are trying to convert to, otherwise the device will stay in its original site. For billing purposes, devices will retain their site type until they connect to the server. This means that if you are at your purchased Managed device limit and move some Agents to an OnDemand site to free up Managed device licenses, those licenses won't be available for use by new devices until the Agents you moved have finished checking in to the platform.
To move a device from one site to another, follow these steps:
- Click Move to Another Site.
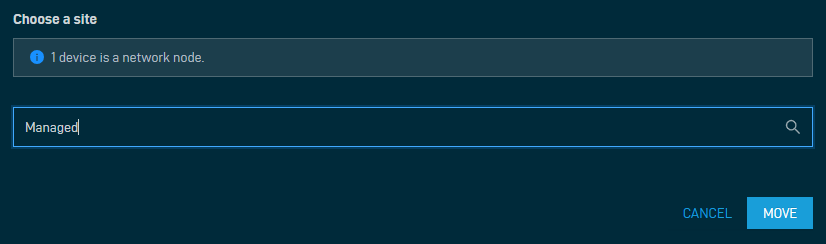
- Enter the name of the site you want to move your device to, then select it from the list. The search results are narrowed as you type.
- Click Move to continue or click Cancel to stop the action. If the device you are trying to move is a Network Node, it will be indicated on the Choose a site page.

NOTE When you move a device to a different site in the New UI, the device's association to its Network Node will remain unchanged. If you move a Network Node device to another site, it will keep its Network Node status in the new site and its association to network devices will remain unchanged. For more information, refer to Assigned Network Node.
NOTE Datto Networking or Datto Continuity devices cannot be moved between Datto RMM sites. If any Datto Networking or Datto Continuity devices are selected to be moved to another site along with Datto RMM devices, these devices will be excluded from the move, and a message is displayed prompting you to update the mapping. The selected Datto RMM devices will then be moved to the new site. Refer to Map RMM sites to Datto Networking networks or Map Datto Continuity devices to Datto RMM sites.
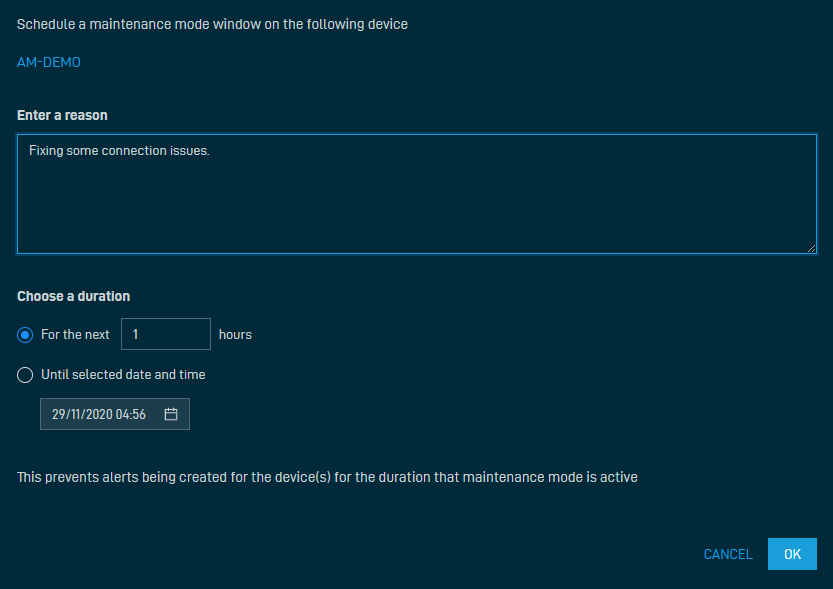
Creating an unscheduled maintenance mode window
You can place a device in an ad-hoc maintenance mode that will prevent alerts from being generated for a specified time frame.
-
Click Create a Maintenance Mode Window.
-
Enter a reason for the maintenance.
-
Choose a duration:
-
For the next (1-100) hours: By default it is set for the next one hour.
-
Until selected date and time: Use the calendar to set a date of expiry for the maintenance mode window.
-
-
Click OK to create the maintenance mode window or click Cancel to stop the action.

NOTE Additional unscheduled maintenance mode windows can be created by following the same steps as outlined above. You can also place multiple devices in unscheduled maintenance mode through a single action on the Devices page. Refer to Action buttons.
NOTE You can also create a scheduled maintenance mode window through a policy. Refer to Maintenance policy.
Maintenance mode status indicator
Once a device has been placed into maintenance mode, an icon is displayed next to the device name at the top of the Device Summary page. A device can have multiple maintenance mode windows configured that are all displayed in this view. Hover over the icon to see if it is an unscheduled or scheduled maintenance mode window, when it is going to end, who created it and when, and what the reason was for the maintenance. When a device is in a scheduled maintenance mode window, you can click the policy name to see the policy details. Refer to Editing a policy.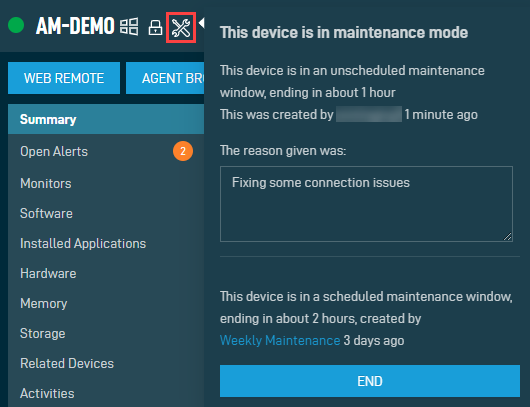
NOTE You can create a maintenance mode widget to see all devices currently in maintenance. Refer to Devices Under Maintenance.
Ending a maintenance mode window
-
Hover over the maintenance mode icon. Refer to Maintenance mode status indicator.
-
Click End. This will end all (both unscheduled and scheduled) maintenance mode windows configured for the device.
NOTE You can also end multiple devices' maintenance mode windows through a single action on the Devices page. Refer to Action buttons.
NOTE To end a scheduled maintenance mode window, you can also update the associated Maintenance policy so that it no longer targets the device. Refer to Editing a policy.
Refer to Scheduled jobs - New UI.
Click Request Audit to request a full audit of the device.
This action is not available for OnDemand devices. For network devices, printers, and ESXi devices, this action is only available if the device is assigned to a Network Node. Refer to Assigned Network Node.
For information about audits, including full and delta audits and their frequency, refer to Audits. To learn how to initiate a full or a delta audit in the current UI, refer to Perform a manual audit.
Refer to Creating a ticket - New UI.
Refer to Deleting a device - New UI.
Refer to Action buttons.
Refer to Action buttons.
Click Copy Device Information to Clipboard to copy the following device information to the clipboard:
- ID (internal database ID)
- UID (device ID)
- Site ID
- Hostname
- Operating system
- Site name
- Manufacturer
- Model
- .NET version
- Is 64-bit?
- Last audit date
- Agent version
- Last reboot date
- Patch status
- Antivirus status
- Antivirus product
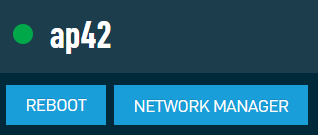
Click the button to reboot the device. For Managed Power devices, rebooting will only reboot the control board on the device, not the actual devices connected. Uptime will be displayed in the Summary card for the device after a reboot.
NOTE If you have at least View access enabled under Setup > Security Levels > Permissions > Sites > Devices, then you can reboot Datto Networking devices. No additional permissions are required. Refer to Security Level Details - Permissions.
Click the button to open the device in the Network Manager. Refer to Datto Network Manager: Getting Started.
Connect to the Datto Continuity device in the Datto Partner Portal. Only available when the Datto Continuity device is online. Refer to Protect Page.
Open the Datto Continuity device page in the Datto Partner Portal. Refer to Datto Partner Portal: BCDR Status (Device Details).
Open the Recovery Launchpad in the Datto Partner Portal. Refer to Partner Portal: New Recovery Launchpad restore options.
Cards
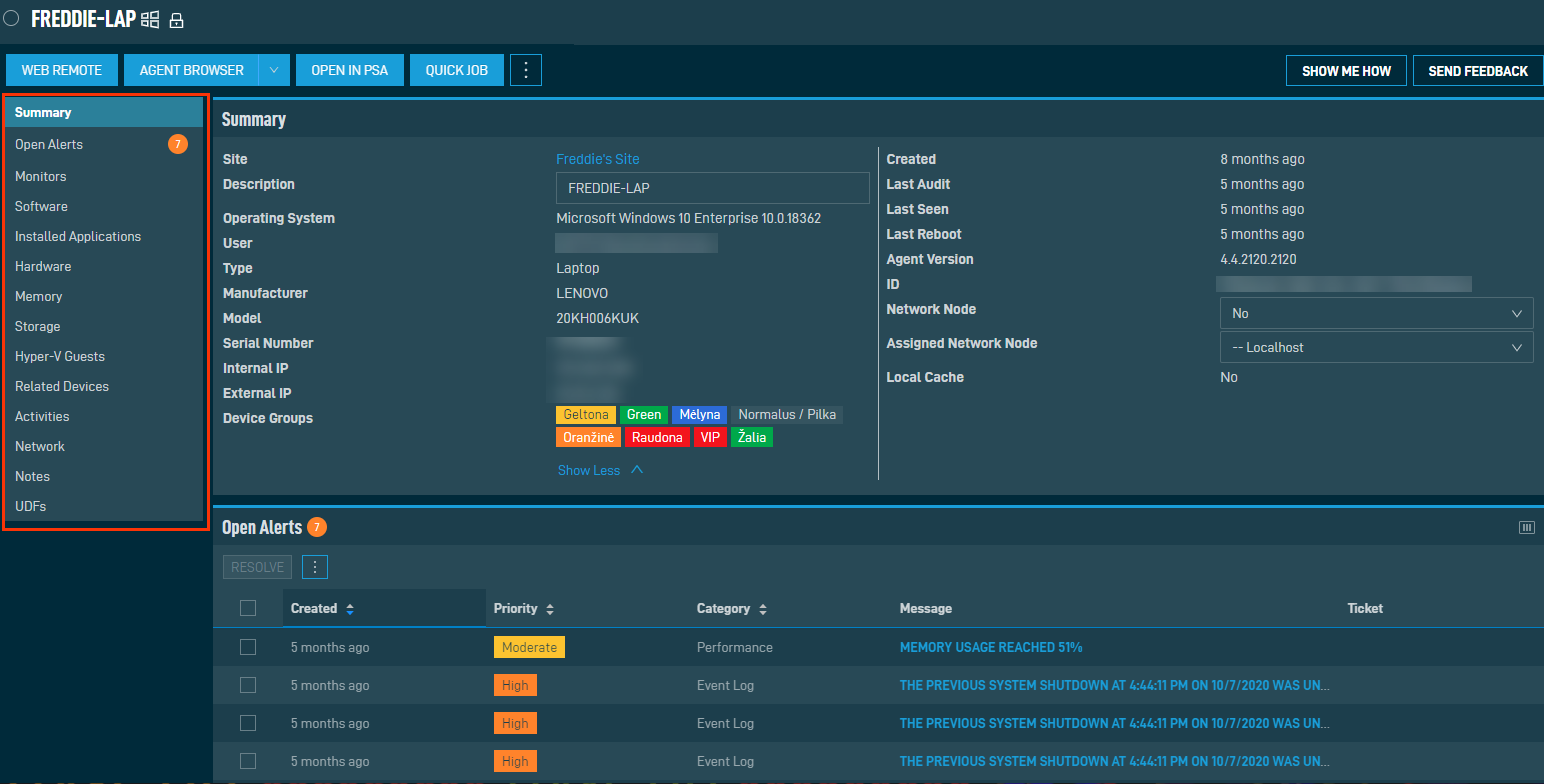
The Device Summary page displays a number of sections called cards that contain a wealth of information about your devices. Click the name of any of the cards on the left-hand side of the page to jump straight to that section. On the right-hand side of the page, you can drag and drop the cards to reorder them. The new order will persist for all devices of the same device type.
All timestamps on the page reflect the time zone configured on the Setup > My Info tab. Refer to Time Zone.
Different device types have different cards available, and the cards may display different fields depending on the device type. The table below lists the available cards per device type. Further down, you will find information about each card type.
| Card | Server/Laptop/Desktop | Network Device | Printer | Datto Networking | Datto Continuity | ESXi | ||||
|---|---|---|---|---|---|---|---|---|---|---|
| Access Point | Switch | Managed Power | ALTO | SIRIS | vSIRIS | |||||
| Summary |
|
|
|
|
|
|
|
|
|
|
| Open Alerts |
|
|
|
|
|
|
|
|||
| Monitors |
|
|
|
|
|
|
|
|||
| Software |
|
|
|
|
||||||
| Installed Applications |
|
|
|
|
||||||
| Hardware |
|
|
|
|
|
|||||
| Memory |
|
|
|
|
|
|||||
| Storage |
|
|
|
|
|
|||||
| Hyper-V Guests |
|
|
|
|
||||||
| Related Devices |
|
|
|
|
|
|
|
|
|
|
| Protected Devices |
|
|
|
|||||||
| Datto Continuity |
|
|
|
|||||||
| Activities |
|
|
|
|
|
|
|
|||
| Network |
|
|
|
|
|
|||||
| Notes |
|
|
|
|
|
|
|
|
|
|
| UDFs |
|
|
|
|
|
|
|
|
|
|
| Supplies |
|
|
|
|
||||||
| Connected Devices |
|
|
|
|
||||||
| Network Traffic |
|
|
|
|
|
|||||
| Ports (Datto Switch) |
|
|
|
|
||||||
| Ports (Datto Managed Power) |
|
|
|
|
||||||
| Power Consumption |
|
|
|
|
||||||
| Guests |
|
|
|
|
||||||

The Summary card displays different fields depending on the device type.
| Field | Server/Laptop/Desktop | Network Device | Printer | Datto Networking | Datto Continuity | ESXi | Note | ||||
|---|---|---|---|---|---|---|---|---|---|---|---|
| Access Point | Switch | Managed Power | ALTO | SIRIS | vSIRIS | ||||||
| Hostname |
|
|
|
|
|
|
Click in the field to update the device's hostname. The change is saved automatically. | ||||
| Site |
|
|
|
|
|
|
|
|
|
|
Click the site name to open the Site Summary page. |
| Description |
|
|
|
|
|
|
|
|
|
|
Click in the field to update the device's description. The change is saved automatically. Editing this field is not available for Datto Networking devices. NOTE This field has a limit of 255 characters. NOTE You can also have the Agent update the device's Description field. The process is identical to the one used for UDF data update. For more information, refer to Populate user-defined field information by the Agent. |
| Operating System |
|
|
|
|
|
||||||
| User |
|
|
|
|
|||||||
| Type |
|
|
|
|
|
|
|
|
|
|
|
| Manufacturer |
|
|
|
|
|
||||||
| Model |
|
|
|
|
|
|
|
Network devices: only displayed for Cisco devices. | |||
| Serial Number |
|
|
|
|
|
Network devices: only displayed for Cisco devices. Dell devices: click the serial number to navigate to the manufacturer's support page. |
|||||
| Internal IP |
|
|
|
|
|
|
|
|
|
||
| External IP |
|
|
|
|
|
|
|||||
| Device Groups |
|
|
|
|
|
|
|
|
|
|
Displays the groups this device belongs to. If the device belongs to more than five device groups, click View More to display all of the groups. The groups are listed in alphabetical order. Click a group to open a pane to the right to edit, delete, or manage device membership for this group. Refer to Groups - New UI. |
| Created |
|
|
|
|
|
|
|
|
|
|
|
| Last Seen |
|
|
|
|
|
|
|
|
Only displayed for offline devices. Datto Continuity devices may still display as online since these devices check in every 10 minutes. |
||
| Last Audit |
|
|
|
|
|
|
|
||||
| Last Reboot |
|
|
|
|
|||||||
| Agent Version |
|
|
|
|
|||||||
| ID |
|
|
|
|
|
|
|
|
|
|
|
| Network Node |
|
|
|
|
The field indicates whether the device has been nominated as a Network Node. The drop-down menu lists the following options: • No: The device is not a Network Node. • Yes - Without Scanning: The device is a Network Node and it can monitor network devices, printers, and ESXi devices. • Yes - With Scanning: The device is a Network Node. It can discover devices on the network and it can also monitor network devices, printers, and ESXi devices. For more information, refer to Network discovery. |
||||||
| Assigned Network Node |
|
|
|
|
|
|
|
The field displays the name of the device's Network Node. Click the drop-down menu to select a Network Node from the list. All Network Nodes of the Datto RMM account are displayed. Network Nodes of the site that the device belongs to are displayed first. Other sites' Network Nodes are grouped in their respective site within the drop-down list. The sites can be expanded and collapsed. You can assign any of the Network Nodes from any of the sites to the device. Devices that can have an Agent installed also have an option called Localhost because these devices will attempt and be able to monitor themselves. When Localhost is selected on a Windows device, the Agent will use the 127.0.0.1 loopback address (instead of the Internal IP Address). Devices that cannot have an Agent installed and therefore cannot monitor themselves will have an option called Unassigned. For more information about Network Nodes, refer to Network discovery. |
|||
| Local Cache |
|
|
|
|
|||||||
| ESXi Credential |
|
|
|
|
Click the drop-down menu to select a set of ESXi credentials from the list. Global ESXi credentials will be displayed in addition to site-level ESXi credentials, unless the use of global (account-level) credentials is disabled in Site Settings. For information on how to store ESXi credentials, refer to Account Settings and Site Settings in the current UI and ESXi credentials in the New UI. |
||||||
| SNMP Credential |
|
|
|
|
|
|
Click the drop-down menu to select a set of SNMP credentials from the list. Global SNMP credentials will be displayed in addition to site-level SNMP credentials, unless the use of global (account-level) credentials is disabled in Site Settings. You can also choose any of the Default SNMP Credentials (v1 and v2c, public) listed here. In case the SNMP credentials set in Account Settings or Site Settings are deleted, the Default SNMP Credentials will be used automatically. For information on how to store SNMP credentials, refer to Account Settings and Site Settings in the current UI and SNMP credentials in the New UI. |
||||
| NIC Vendor |
|
|
|
|
|
||||||
| SNMP Name |
|
|
|
|
|
||||||
| SNMP Description |
|
|
|
|
|
||||||
| SNMP Location |
|
|
|
|
|
||||||
| SNMP Contact |
|
|
|
|
|
||||||
| SNMP Uptime |
|
|
|
|
|
||||||
| Object ID |
|
|
|
|
|
||||||
| MAC Address |
|
|
|
|
|
|
|
|
|||
| Warranty Expiration |
|
|
|
|
|
This field displays the date the device's warranty expires or is blank if no warranty date is set. For Datto Continuity devices, hover over the time shown in the Warranty Expiration to view the exact date. If the warranty expiration date is in the past, the word Expired is highlighted in red below the date. This field is not populated automatically. Click in the field to update the device's warranty date. Enter the date manually (YYYY/MM/DD) or choose it from the calendar. The change is saved automatically. NOTE Alternatively, you may consider using a third-party integration to populate this field. NOTE If either the Autotask PSA Integration or the ConnectWise Manage Integration is enabled, this information is only synced to your PSA if it is not in the PSA at the time of synchronization. NOTE For Datto Continuity devices, this field is not editable from within Datto RMM. |
|||||
| Printed Page Count |
|
|
|
|
|||||||
| Firmware Version |
|
|
|
|
|
|
|||||
| Uptime |
|
|
|
|
|
|
|||||
| Gateway IP |
|
|
|
|
|||||||
| Surge Protection Active |
|
|
|
|
|||||||
| Client Company Name |
|
|
|
||||||||
| Local Storage Used |
|
|
|
||||||||
| Local Storage Available |
|
|
|
||||||||
| Offsite Storage Used |
|
|
|
||||||||
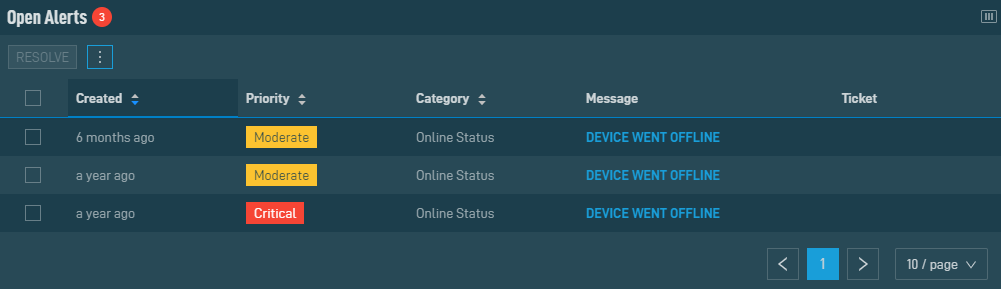
The Open Alerts card displays a list of the device's open alerts. The card header has a badge showing the number of alerts, and the color of the badge matches the color of the highest priority alert in the list.
Various table actions are available.
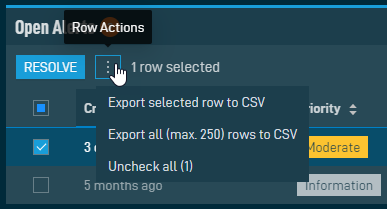
The action buttons are grayed out if no row is selected or if the action is not applicable to the selected rows. The selection box allows you to select one or more rows. Select all rows shown by checking the selection box in the table header. To access all action buttons, click the Row Actions icon at the end of the row. The table below lists all available action buttons.
| Action Button | Description |
|---|---|
| Resolve | Resolves the selected alert(s). If you have selected multiple alerts to resolve, a confirmation pop-up window will appear. Select OK to resolve the alerts. Once resolved, alerts are removed from the table.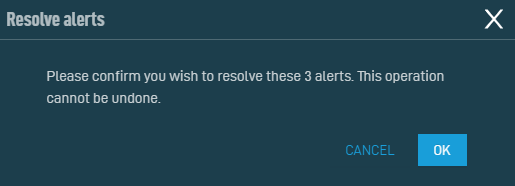 |
| Export Selected Rows to CSV | In the confirmation dialog box, select whether to show table headers in the file by toggling the Show table headers in the exported CSV button. Select OK to download the file. Any column selections or filters that have been applied to the table will also be applied in the CSV file. A maximum number of 250 rows can be exported to a single CSV file. The Export All (Max. 250) Rows to CSV action is available without selecting any row in the table.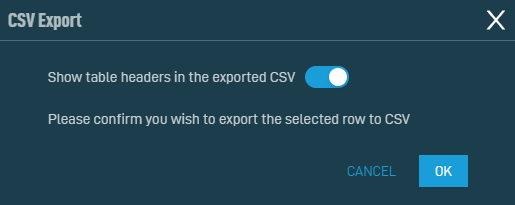 |
| Export All (Max. 250) Rows to CSV | |
| Uncheck All | Deselects all selected rows. The number of selected rows is indicated in parentheses and next to the Row Actions icon. |
The Column Chooser allows you to select which columns should be visible in the list. Refer to Column Chooser field definitions for descriptions of all of the available fields.
The number of results displayed can be specified by selecting the desired number from the drop-down menu at the bottom of the table. This selection will persist the next time the page is accessed.
The Monitors card displays a list of the device's monitors. The card header has a badge showing the number of monitors. You can choose from the following display options: Small tiles, Large tiles, Detailed view (selected by default).
Tiles view
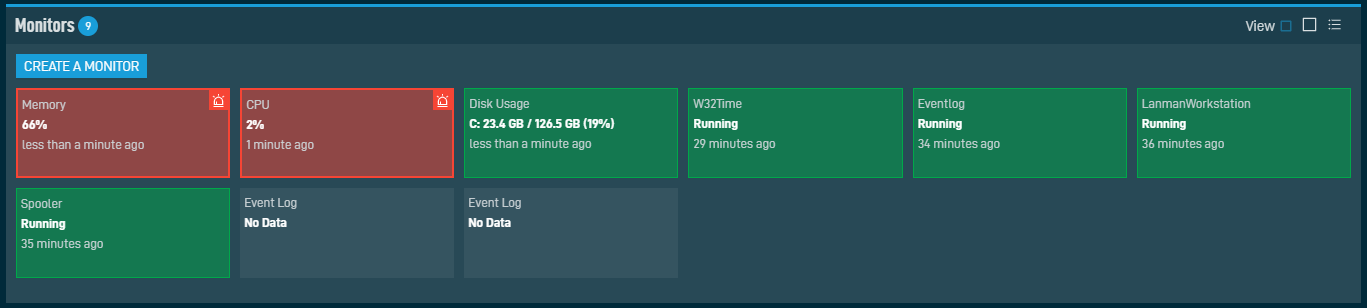
- Limited information is displayed: monitor type, latest value, last reading, View Alert icon.
- Only active (enabled) monitors are shown.
- Allows you to create a monitor. Refer to Creating a monitor.
Detailed view
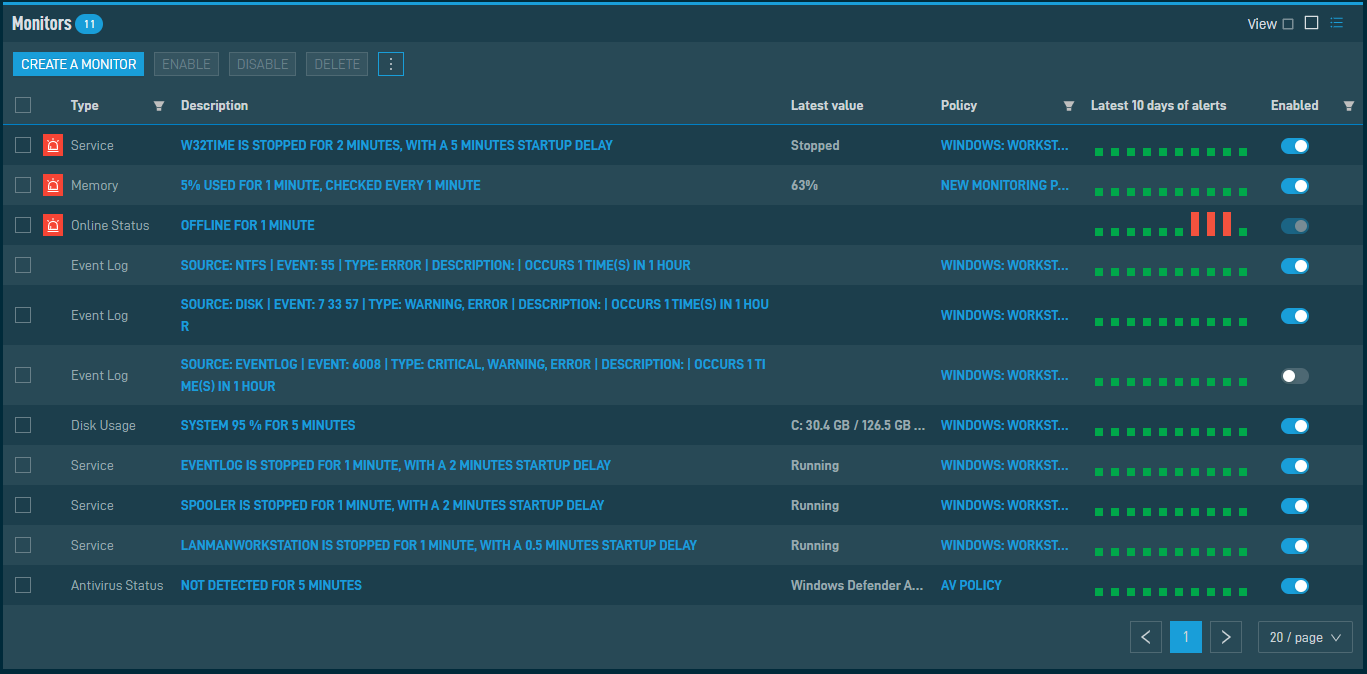
- Detailed information is displayed. Refer to Table information (detailed view).
- Both active (enabled) and disabled monitors are listed. The rows are displayed in the following order: alerting monitors, enabled but not alerting monitors, disabled monitors.
- Allows you to create a monitor. Refer to Creating a monitor. Various other table actions are also available. Refer to Action buttons (detailed view).
-
The number of results displayed can be specified by selecting the desired number from the drop-down menu at the bottom of the table. This selection will persist the next time the page is accessed.
Action buttons (detailed view)
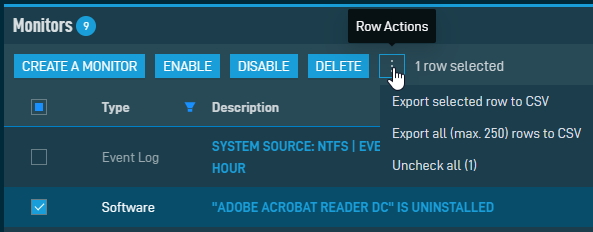
The action buttons are grayed out if no row is selected or if the action is not applicable to the selected rows. The selection box allows you to select one or more rows. Select all rows shown by checking the selection box in the table header. To access all action buttons, click the Row Actions icon at the end of the row. The table below lists all available action buttons.
| Action Button | Description |
|---|---|
| Create a Monitor | This action is available without selecting any row in the table. Refer to Creating a monitor. |
| Enable | Enables/disables the monitor. This is only available for monitors within policies. SNMP monitors: if a monitor has an instance, enabling/disabling the monitor will enable/disable the parent monitor and all related instance monitors. |
| Disable | |
| Delete | Deletes the selected monitors upon confirmation. This is only available for standalone monitors. SNMP monitors: if a monitor has an instance, this action will delete the parent monitor. |
| Export Selected Rows to CSV | In the confirmation dialog box, select whether to show table headers in the file by toggling the Show table headers in the exported CSV button. Select OK to download the file. Any column selections or filters that have been applied to the table will also be applied in the CSV file. A maximum number of 250 rows can be exported to a single CSV file. The Export All (Max. 250) Rows to CSV action is available without selecting any row in the table. |
| Export All (Max. 250) Rows to CSV | |
| Uncheck All | Deselects all selected rows. The number of selected rows is indicated in parentheses and next to the Row Actions icon. |
Table information (detailed view)
| Field | Description |
|---|---|
| View Alert | The alert icon indicates that the monitor is currently in an alerting state. Click the icon to see the most recent alert raised by the monitor. Refer to Single Alert View - New UI.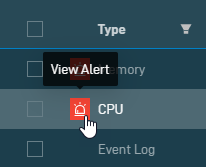 |
| Type | Displays the monitor type. Click the Filter Menu icon and select the types of monitors you wish to view in the list. Click All to see all monitor types. Refer to Monitor types.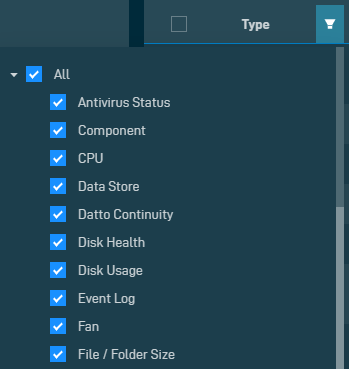 |
| Description | Displays the parameters specified in the monitor. Refer to Configure the Trigger Details. in the current UI and Alert details per monitor type in the New UI. SNMP monitors: when data is available, the instance names are added to the description. Datto Continuity monitors: If you have both the Datto BCDR Integration and the Datto Continuity Integration enabled, the monitor and alert raised will apply only to the Datto Continuity Integration. Refer to Datto BCDR. Click the description of a monitor to see its details. Refer to Viewing monitor details. |
| Latest Value | Displays the latest measured value. A warning is displayed if the monitor will not work for this device. Hover over the latest value to see when the data was received . The Agent will only send data when the monitor result changes or one hour has passed since the last reading. NOTE Any Drive Disk Usage monitor will only show value for a drive that is closest to the threshold set within the monitor. Refer to Disk Usage Monitor (Windows only) in the current UI and Disk Usage monitor in the New UI. NOTE ESXi Data Store monitor will only show the datastore that is closest to the threshold set within the monitor. Refer to ESXi Data Store Monitor in the current UI and ESXi Data Store monitor in the New UI. NOTE Real-time monitoring metrics are stored for seven days and up to a maximum of 60 metrics. If no data is received in seven days (e.g., the device goes offline), the Latest Value field will be blank. This field is always blank for Event Log monitors and Ransomware monitors. |
| Policy | Displays the name of the policy that the monitor is part of. This field is empty for standalone monitors. Click the policy name to see and update the policy details. Refer to Policies - New UI. To narrow the list, click the Filter Menu icon, enter a term, and select a policy from the list. The search results are narrowed as you type. To see the full list, click Reset. 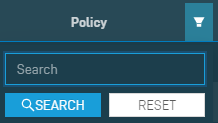 |
| Latest 10 Days of Alerts | Displays if the monitor raised an alert in the last 10 days. Hover over the bars to see the dates. The alert status is displayed the following way: • Short, green bars: no alert was raised. • Tall, red bars: the monitor raised at least one alert. Click the bar to see the most recent alert raised on that day. Refer to Single Alert View - New UI. 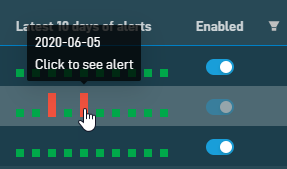 |
| Enabled | Refer to Enable. Click the Filter Menu icon and click Yes or No to filter by the enabled status of the monitors. To see the full list of monitors, click All.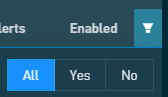 |
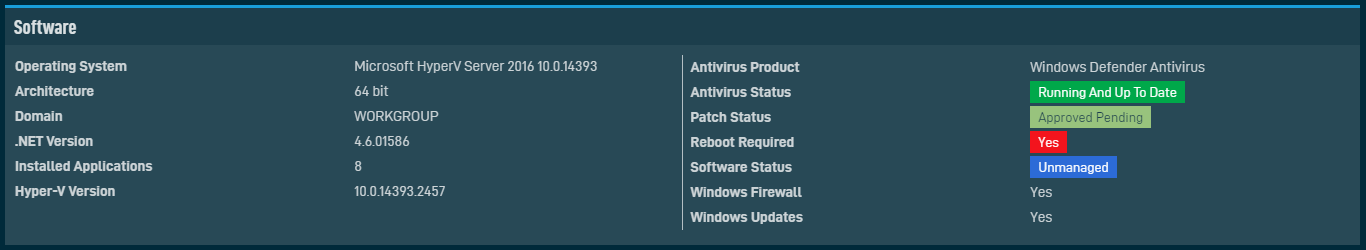
The Software card contains the following information:
| Field | Note |
|---|---|
| Operating System | |
| Architecture | |
| Domain | |
| .NET Version | |
| Service Pack | If the device's operating system does not have service packs, the field will not be displayed. |
| Installed Applications | Refer to Installed Applications. |
| Hyper-V Version | Only displayed for Hyper-V-enabled devices. |
| Antivirus Product | Refer to Antivirus products. |
| Antivirus Status | Refer to Antivirus status. The highlight legend is as follows: • Green - Running And Up To Date • Yellow - Running And Not Up To Date • Orange - Not Detected • Red - Not Running |
| Patch Status | Only available for Windows devices. Refer to Patch Management. The highlight legend is as follows: • Green - Fully Patched • Light green - Approved Pending • Yellow - Install Error • Orange - Reboot Required • Red - No Policy • Red orange - No Data |
| Reboot Required | Only displayed if the device needs to be rebooted. |
| Software Status | Only available for Windows and macOS devices. Refer to Software Management. The highlight legend is as follows: • Green - Compliant • Orange - Non Compliant • Blue - Unmanaged |
| Windows Firewall | Only available for Windows devices. |
| Windows Updates | Only available for Windows devices. |
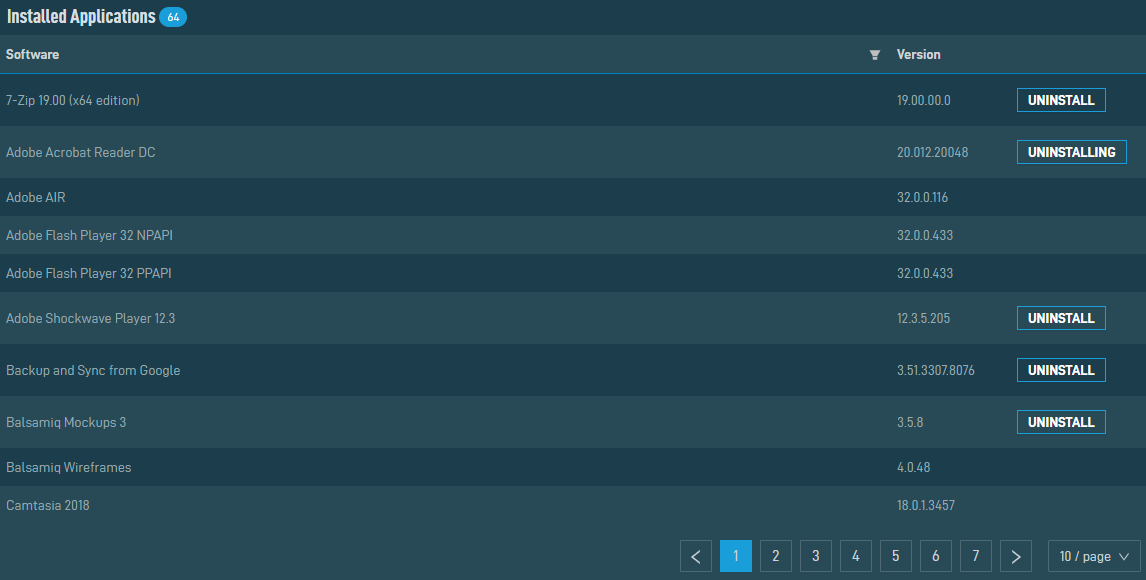
The Installed Applications card displays all applications that are installed on the device. The card header shows the total number of applications in parentheses.
The number of results displayed can be specified by selecting the desired number from the drop-down menu at the bottom of the table. This selection will persist the next time the page is accessed.
The table contains the following information:
| Column | Description |
|---|---|
| Software | Displays the name of the software application. To narrow the list, click the Filter Menu icon, enter a term, and click Search. To see the full list of applications again, click Reset. 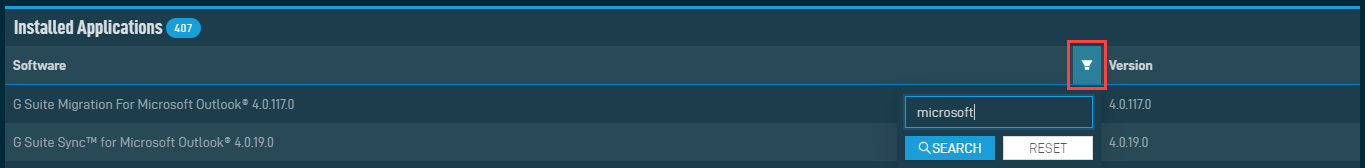 |
| Version | Displays the version number of the software application. |
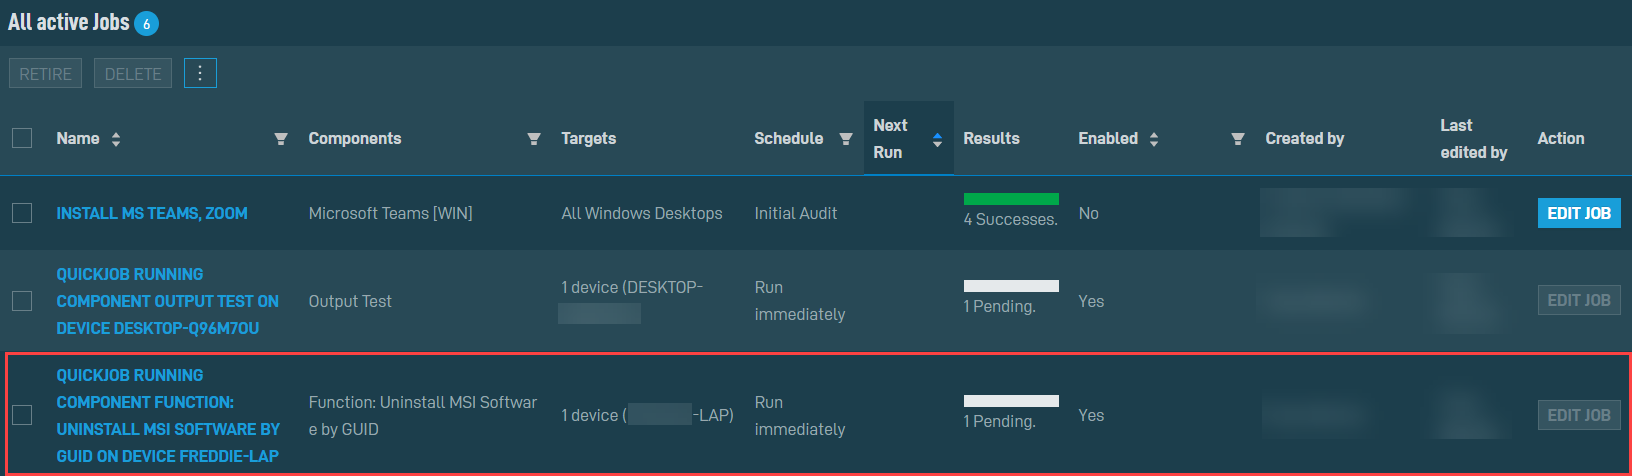
| Uninstall | This button appears in the table for all Windows applications with an MSI uninstaller. Click the Uninstall button. The application will be uninstalled from the device upon confirmation. NOTE You must have permissions to run quick jobs. Refer to Quick jobs - New UI. Once clicked, the button displays Uninstalling and a quick job is created that will uninstall the application. The quick job is visible on the Activities card. Refer to Activities. NOTE If the job is deleted or cancelled before it runs, the software will no longer be flagged for uninstallation, and the button will once again display Uninstall. Quick jobs are editable in the Web Portal only. Once the uninstall process has completed successfully and the software has been removed from the device, the application will no longer appear in the Installed Applications card once the page is refreshed. Details about the uninstalled application are viewable in the StdOut. Refer to Activity details. |

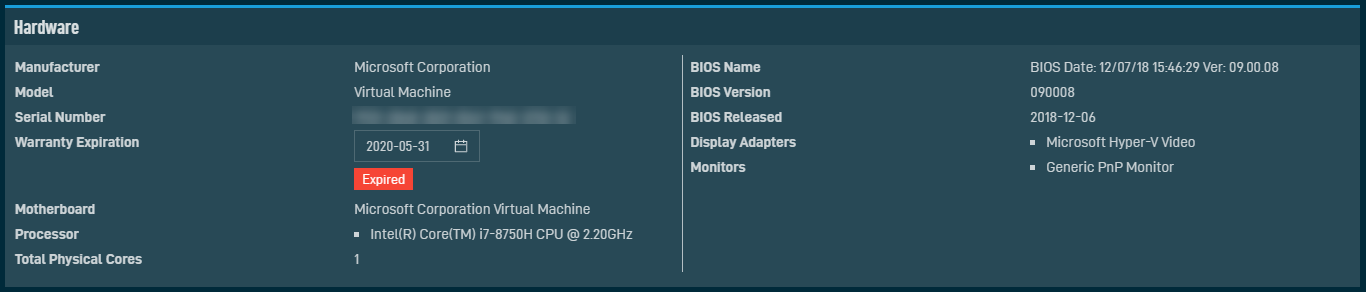
The Hardware card displays different fields depending on the device type.
| Field | Server/Laptop/Desktop | ESXi | Note |
|---|---|---|---|
| Manufacturer |
|
|
|
| Model |
|
|
|
| Serial Number |
|
||
| Warranty Expiration |
|
|
This field displays the date the device's warranty expires or is blank if no warranty date is set. For Datto Continuity devices, hover over the time shown in the Warranty Expiration to view the exact date. If the warranty expiration date is in the past, the word Expired is highlighted in red below the date. This field is not populated automatically. Click in the field to update the device's warranty date. Enter the date manually (YYYY/MM/DD) or choose it from the calendar. The change is saved automatically. NOTE Alternatively, you may consider using a third-party integration to populate this field. NOTE If either the Autotask PSA Integration or the ConnectWise Manage Integration is enabled, this information is only synced to your PSA if it is not in the PSA at the time of synchronization. |
| Motherboard |
|
||
| Processor |
|
|
Server/laptop/desktop devices: the information includes the name and speed of the processor. ESXi devices: the information includes the name, speed, and total cores of the processor. |
| Total Physical Cores |
|
||
| BIOS Name |
|
||
| BIOS Version |
|
||
| BIOS Released |
|
||
| Display Adapters |
|
||
| Monitors |
|
||
| Service Asset Tag |
|
||
| Total CPU Sockets |
|
||
| Total Free CPU Sockets |
|
||
| Snapshots |
|
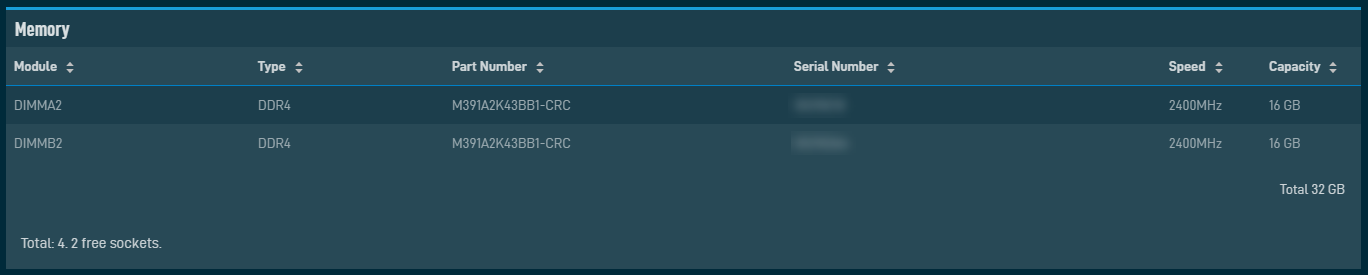
The Memory card displays different information depending on the device type.
| Column | Sortable? | Server/Laptop/Desktop | ESXi |
|---|---|---|---|
| Module |
|
|
|
| Type |
|
|
|
| Part Number |
|
|
|
| Serial Number |
|
|
|
| Speed |
|
|
|
| Capacity |
|
|
|
| Total Memory |
|
|
|
| Total Memory Sockets |
|
||
| Total Free Memory Sockets |
|
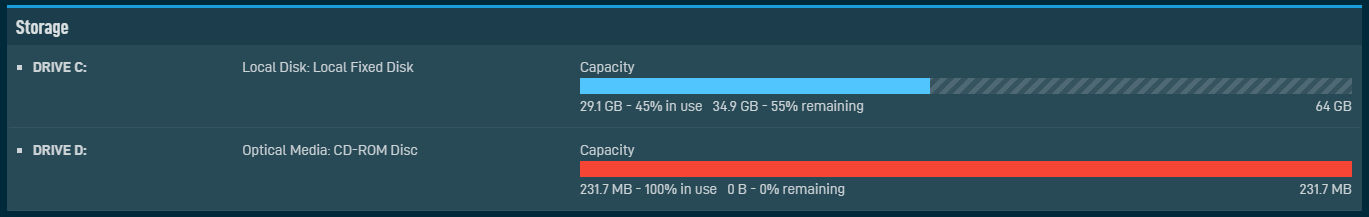
The Storage card displays different information depending on the device type.
| Field | Server/Laptop/Desktop | ESXi | Description |
|---|---|---|---|
| Name of Storage |
|
|
|
| Description: Drive Type |
|
The description and type of the drive, e.g. Local Disk: Local Fixed Disk. | |
| Capacity |
|
|
A graph displaying how much disk space is in use and remaining in each storage, e.g. 29.1 GB - 45% in use, 34.9 GB - 55% remaining / 64 GB. The bar turns red when the drive has reached 70% of its capacity. NOTE On macOS devices with an APFS partition (container), each APFS volume's available disk space is presented as the available disk space in the container (that is, the total size of the container minus the size of all volumes in the container). (Source: macOS support) NOTE The free disk space calculation Datto RMM uses for macOS devices differs from Apple's approach. Therefore, the number shown in the Storage card is different from what is shown on a macOS device. The Datto RMM Agent sends the information about the number of free bytes to the platform, and the platform divides that by 1024*1024*1024 to get a number in GB. Apple, however, divides the same number of free bytes by 1000*1000*1000 to get a number in GiB. |
| Status |
|
||
| Extent |
|
Displays the number of extents on the storage. Click the hyperlink to expand the section.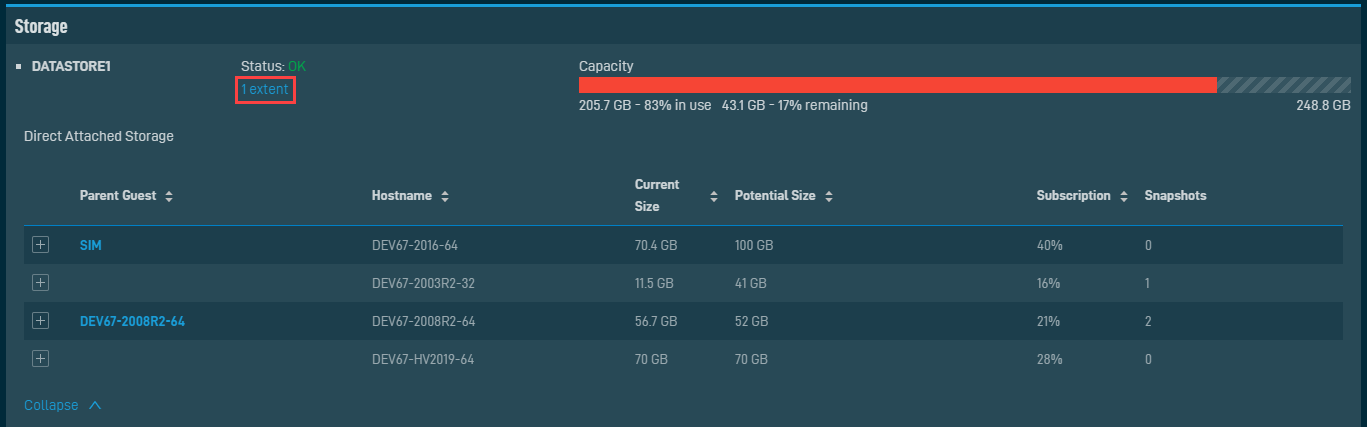 The following information is displayed: • Parent Guest - Click the hyperlink to open the virtual machine's Device Summary page. No hyperlink is displayed for devices that are not added to Datto RMM. • Hostname • Current Size • Potential Size • Subscription • Snapshots All columns are sortable except for Snapshots. Each row can be expanded further to see information on Disk Number, Current Size, and Potential Size. 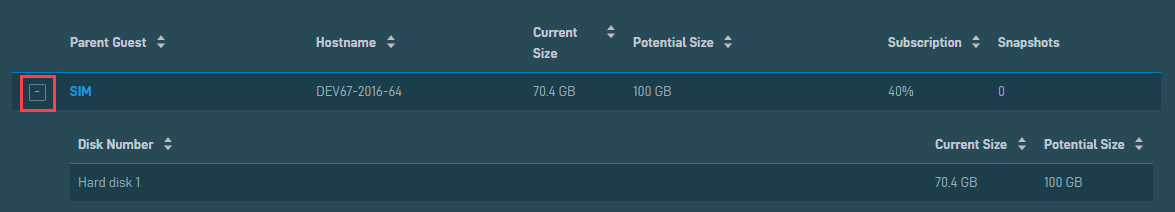 All columns are sortable. NOTE Limited information is displayed if the virtual machine doesn't have a Datto RMM Agent installed. |
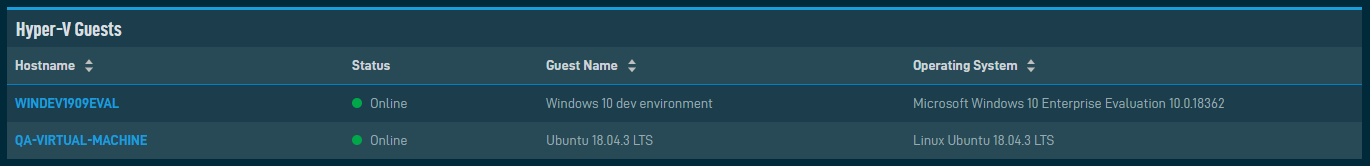
The Hyper-V Guests card displays a list of the device's guest virtual machines. This card is only displayed for Hyper-V-enabled devices.
The table contains the following information:
| Column | Sortable? | Note |
|---|---|---|
| Hostname |
|
Click the hyperlink to open the virtual machine's Device Summary page. No hyperlink is displayed for devices that are not added to Datto RMM. |
| Status | ||
| Guest Name |
|
|
| Operating System |
|
NOTE Limited information is displayed if the virtual machine doesn't have a Datto RMM Agent installed.
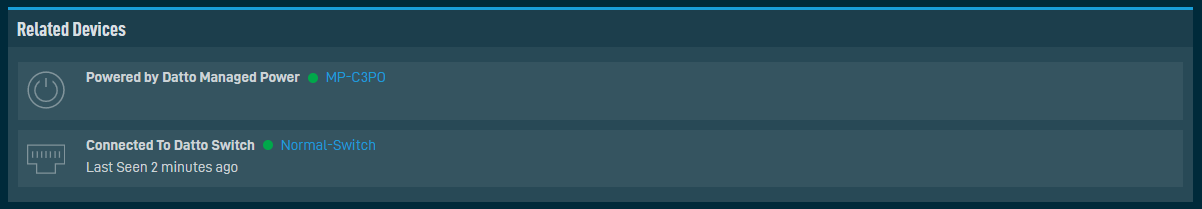
The Related Devices card can display:
- Datto Networking devices that are mapped to the same site a device is associated with.
- The Network Node that is assigned to the device.
- The ESXi host of the device.
- The Hyper-V host of the device.
NOTE These devices are only displayed if the Datto Networking Integration is enabled AND this device is in a site that is mapped to a Datto Networking network. For information about the integration, refer to Datto Networking Integration.
NOTE Datto Managed Power devices must be manually linked to Datto RMM or Datto Continuity devices. Refer to Ports (Datto Managed Power).
The card contains the following information:
| Field | Description |
|---|---|
| Icon | Displays the device type icon of the related device. |
| Device type | Displays the device type of the related device. This field also provides information about the relationship between the two devices, for example, Powered by Datto Managed Power or Connected to Datto Switch. |
| Last seen | Displays when the related device was last seen. This information is not displayed for Datto Managed Power devices. |
| Status | Green circle - The related device is online. Transparent circle - The related device is offline. |
| Hyperlink | Click the hyperlink to open the related device's Device Summary page. |
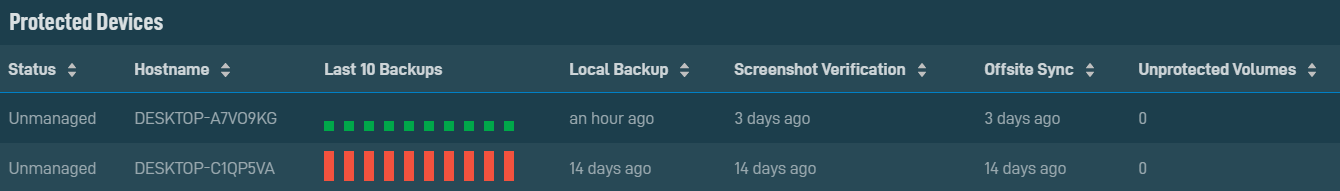
The Protected Devices card is only displayed for Datto Continuity devices if the Datto Continuity Integration is enabled and a Datto RMM device is being protected by this Datto Continuity device. Refer to Datto Continuity Integration.
NOTE A Datto Continuity device reports a list of Agents, which is checked against devices in Datto RMM. Protected devices are then mapped only if both the hostname and IP address match. Protected devices in the same site that share both the same hostname and the same IP address are not supported by this integration.
If the protected device also has a Datto RMM Agent installed, a link is provided to the device. For lists of greater than ten devices, the number of results displayed on one page can be specified at the bottom of the table. You can choose 10/20/50/100 results per page.
The card provides a summary of the backup status of all protected devices, and contains the following information:
| Field | Description |
|---|---|
| Status | The status of the protected device. Statuses include Online, Offline, Managed, and Unmanaged. |
| Hostname | The name of the protected device. Click the link to view the Device Summary page for the protected device. If there are multiple protected devices with the same hostname on the account (in the same site or different sites), these devices are included in the list. |
| Last 10 Backups | The status of the last 10 backups. Hover over the bars to see the dates. The backup status is displayed the following way: • Short, gray outlined bars: no backup was completed. • Short, green bars: the backup was successful. • Medium, yellow bars: the backup completed with warnings or errors. • Tall, red bars: the backup failed. Click the bar to see additional details about the reason for failure. |
| Local Backup | The last time the protected device was backed up. |
| Screenshot Verification | The last time a screenshot was taken of the protected device. |
| Offsite Sync | The last time the protected device was synced. |
| Unprotected Volumes | The number of volumes on the protected device that are not currently being backed up. |
| Agent Status | Paused will appear in this field if the agent on the protected device has been paused. Refer to Pause Backups. Archived will appear if the agent on the protected device has been archived. Refer to Archive Agent. |
The Datto Continuity card is only displayed if the Datto Continuity Integration is enabled and the Datto RMM device is protected by a Datto Continuity device. Refer to Datto Continuity Integration.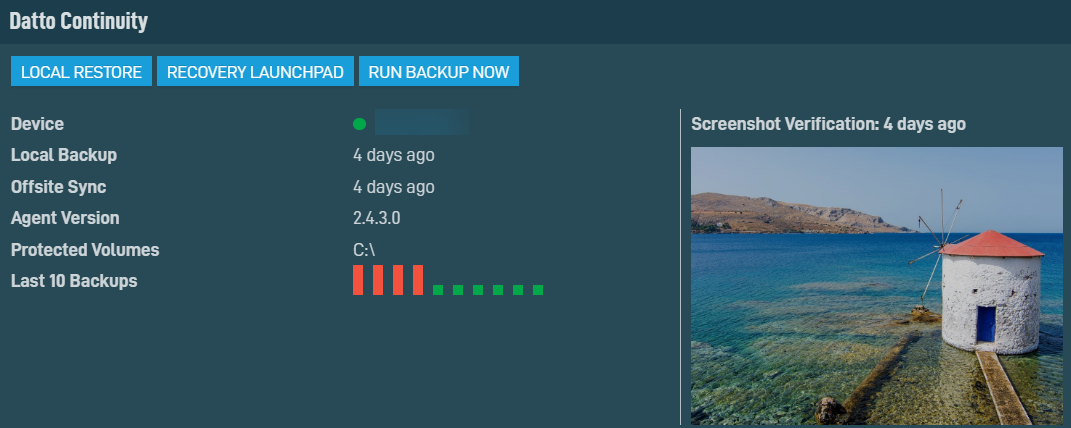
The table below lists all available action buttons.
| Action Button | Description |
|---|---|
| Local Restore | Initiate a local restore of the Datto RMM device that is protected by this Datto Continuity device. Only available when the Datto Continuity device is online. The system and recovery type will be preselected. Choose a recovery point for the device and click Start Restore. Refer to Restore. |
| Recovery Launchpad | Access the Recovery Launchpad, where you can configure the restore method for devices. Refer to Partner Portal: New Recovery Launchpad restore options. |
| Run Backup Now | Run a backup immediately for this device. Only available when the Datto Continuity device is online. The Backup Agents page will be pre-filtered by the selected Agent. Refer to Protect Page. |
The card contains the following information:
| Field | Description |
|---|---|
| Device | A link to the Device Summary page for the Datto Continuity device that is protecting this device. The link also shows whether the device is online or offline. |
| Local Backup | The last time this device was backed up. |
| Offsite Sync | The last time this device was synced. |
| Agent Version | The version of the Datto Windows Agent running on this device. |
| Agent Status | If backups are paused for this device, this field is visible and Paused appears in the field. Refer to Pause Backups. NOTE If the agent has been archived for this device, the Datto Continuity card will not display for this device. |
| Protected Volumes | The drives on this device that are currently protected by the associated Datto Continuity device. |
| Last 10 Backups | A visual representation of the last 10 backups run on this device. Refer to Last 10 Backups. |
| Screenshot Verification | The last screenshot taken on this device and the time the screenshot was taken. |
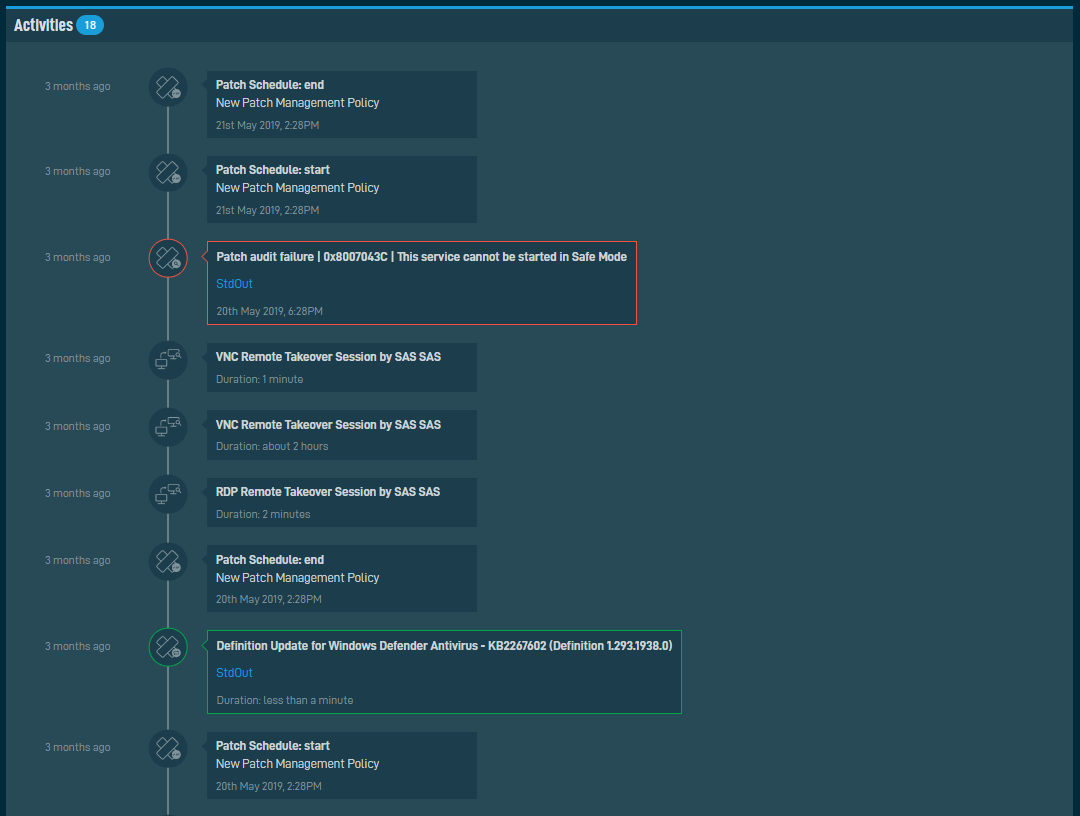
The Activities card displays a list of activities associated with the device, no matter who performed the activity. Datto RMM retains six months of device activity logs.
NOTE Job results older than six months are automatically cleared.
The following information is displayed:
| Field | Description |
|---|---|
| When? | Displays how long ago the activity was performed. |
| Activity type | Hover over the icon to see what kind of activity was performed. The card displays the following activities: • Jobs • Maintenance mode • Patch management • Software management • Security management • Remote connection • Remote takeover • Remote shell • Agent deployment • File transfer sessions • Device moved site • Notes added to device |
| Activity details | Displays the name and various details of the activity, such as who initiated it, when it was performed, and its status. Activities successfully carried out are highlighted in green, while failed activities are highlighted in red. Job names are hyperlinked. Click the hyperlink to see more details about the job. Refer to Job details - New UI. 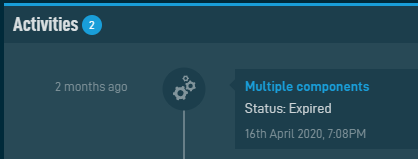 StdOut (standard output) and StdErr (standard error) information may be available for jobs, as well as for patch management and software management activities. Expand the StdErr or StdOut section to see more details and to download the file. The results are available to download within three months. NOTE A job output file can also be downloaded from within an email notification if the job was configured to send an email. Refer to Automatically Email StdOut/StdErr Options. |
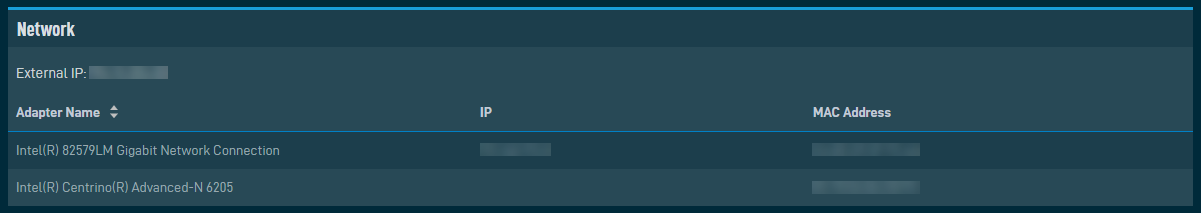
The Network card displays different information depending on the device type.
| Field/Column | Sortable? | Server/Laptop/Desktop | ESXi |
|---|---|---|---|
| External IP |
|
|
|
| Internal IP |
|
||
| Adapter Name |
|
|
|
| IP |
|
|
|
| Speed |
|
||
| MAC Address |
|
|
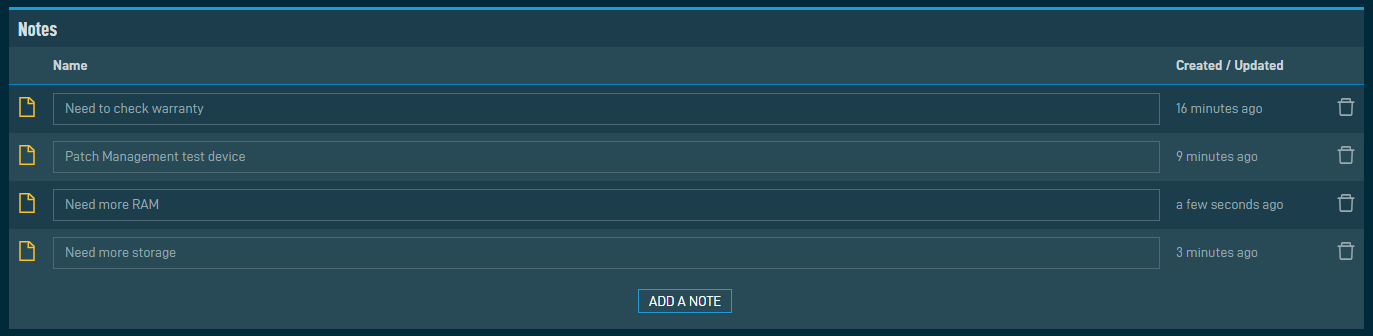
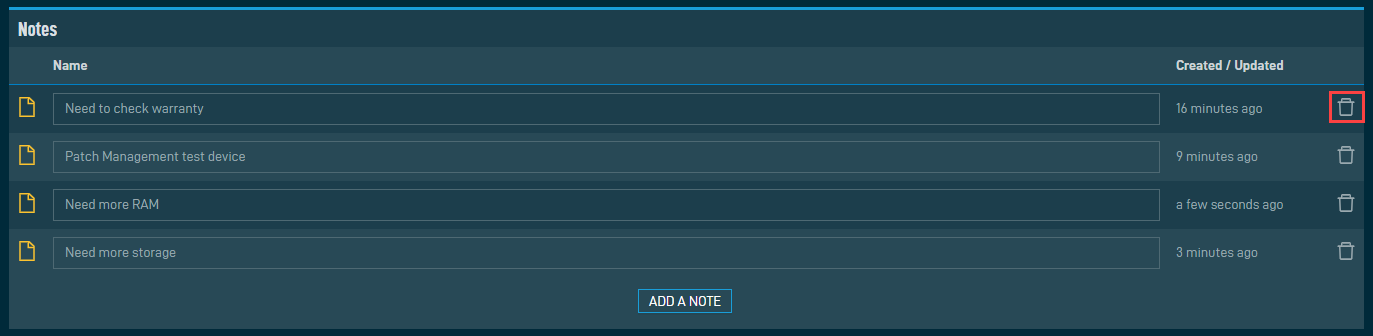
The Notes card displays all notes that have been added to the device. The table contains the following information:
| Column | Description |
|---|---|
| Name | Displays the note. The oldest note is displayed first. |
| Created / Updated | Displays when the note was last updated. |
To manually enter or update notes, follow these steps:
- To add a note, click Add a note and enter the information. The note is saved automatically.
- To update an existing note, click in the field and update the note. The change is saved automatically.
- To delete a note, click the Delete icon, then click OK to confirm the deletion or click Cancel to stop the action.
NOTE You can also add a note to the device in the current UI or through the Agent Browser. For further information, refer to Notes and Notes.
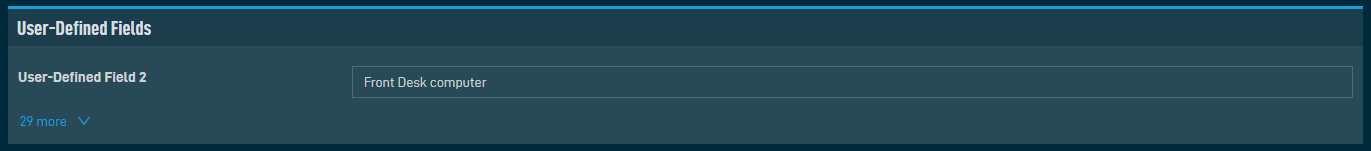
The User-Defined Fields (UDFs) card displays user-defined fields with either their Default Label or Account Label, as defined in Account Settings. UDFs 1-30 are only displayed if they have been populated with information.
To manually enter or update UDF information, follow these steps:
- To populate an unpopulated UDF, click the hyperlink in the card.

- Add the required information to any of the fields. The information is saved automatically.
- To update an already populated UDF, click in the field and edit the information. The change is saved automatically.
- To delete any of the UDFs, click in the field and delete the information. The page will refresh automatically and the UDF will no longer be displayed.

NOTE If a hyperlink is placed in a UDF, you can click the Browse to URL icon to be directed to the link location.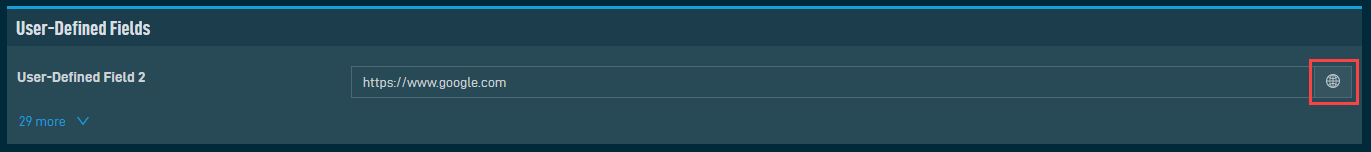
To find out more about UDFs, refer to User-defined fields, Account Settings and Site Settings.
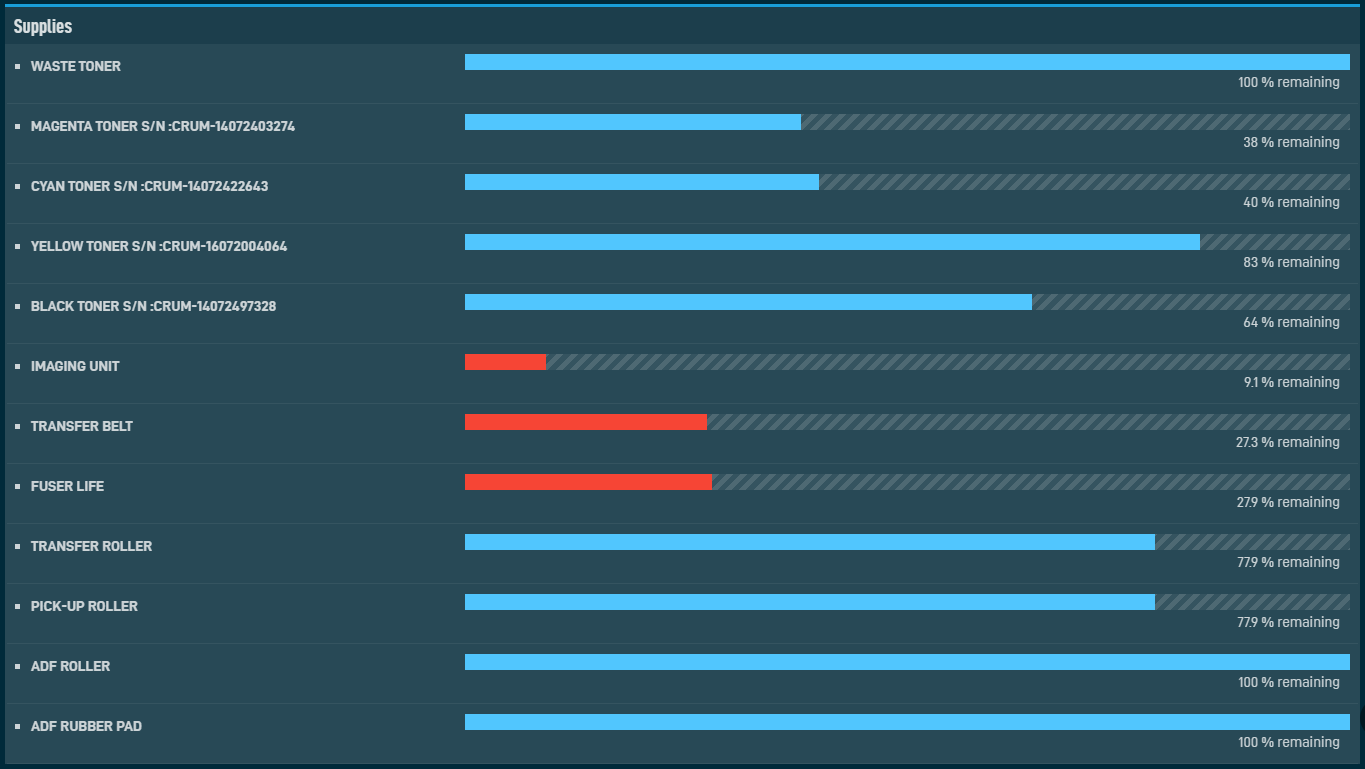
The Supplies card contains the following information:
| Field | Description |
|---|---|
| Printer supply | The name of the printer supply. |
| Graph | Displays the remaining printer supply. The bar turns red once the supply drops below 30%. |
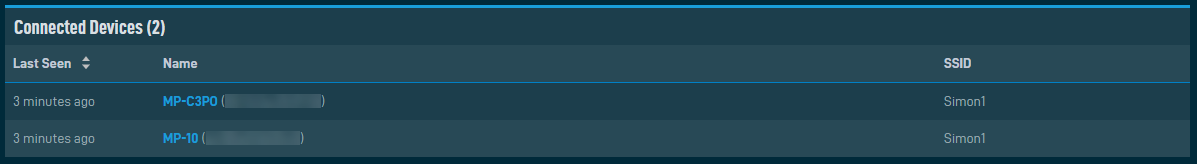
The Connected Devices card displays a list of devices connected to this device. The card header shows the number of connected devices in parentheses.
The table contains the following information:
| Column | Sortable? | Description |
|---|---|---|
| Last Seen |
|
Displays when the connected device was last seen. |
| Name | Displays the name of the connected device and its MAC address in parentheses. Click the hyperlink to open the connected device's Device Summary page. No hyperlink is displayed for devices that are not added to Datto RMM. | |
| SSID | Displays the name of the network that the connected device is on. |
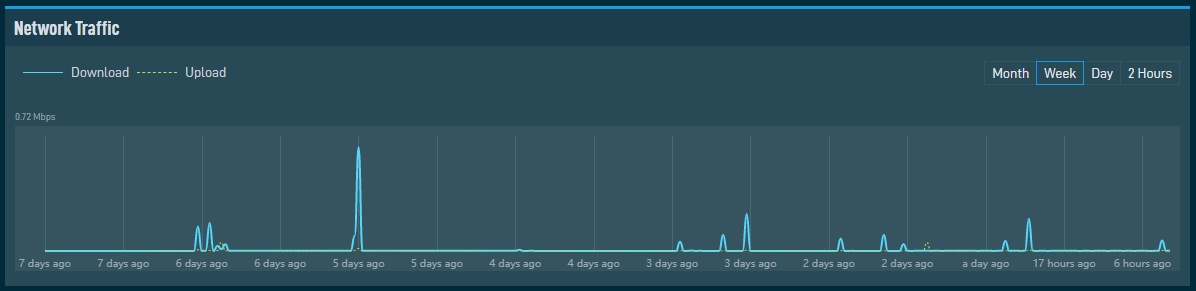
The Network Traffic card displays a graph for the device's network traffic utilization (Mbps). The graph shows Download and Upload data, and you can choose one of the following views: Month, Week (selected by default), Day, 2 Hours.
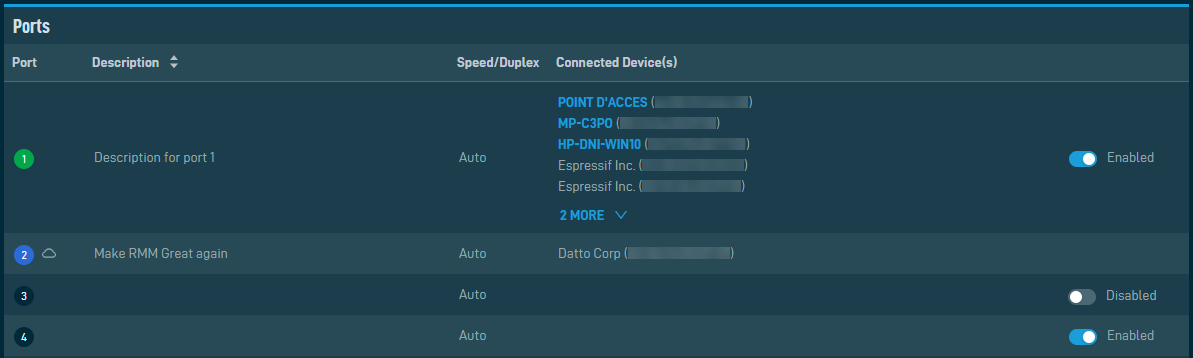
The Ports card of a Datto Switch displays Datto RMM or Datto Continuity devices that are connected to the ports of the switch.
The table contains the following information:
| Column | Sortable? | Description |
|---|---|---|
| Port | Lists the ports of the Datto Switch. Green badge - One or more devices are connected to the port. Blue badge - Indicates an uplink port. Black badge - No device is connected to the port. |
|
| Description |
|
Displays the description of the port. |
| Speed/Duplex | Displays the speed and duplex settings. | |
| Connected Device(s) | Displays the name of the connected device and its MAC address in parentheses. Click the hyperlink to open the connected device's Device Summary page. No hyperlink is displayed for devices that are not added to Datto RMM. | |
| Enabled/Disabled | Indicates the status of the port. Click the toggle button to enable/disable the port. |
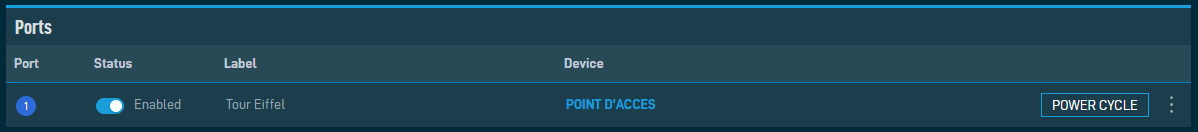
The Ports card of a Datto Managed Power device displays information about the ports of the Managed Power device and whether or not any Datto RMM or Datto Continuity devices are linked to these ports.
The table contains the following information:
| Column | Description |
|---|---|
| Port | Lists the ports of the Datto Managed Power device. |
| Status | Indicates the status of the port. Click the toggle button to enable/disable the port. |
| Label | Displays the label of the port. |
| Device | Displays the name of the device linked to the port. Click the hyperlink to open the linked device's Device Summary page. |
| Power Cycle | Click the button to turn the port off and then back on again. |
| Link a device Unlink device |
Link or unlink a Datto RMM or Datto Continuity device to or from a Managed Power port.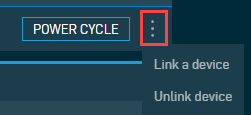 To link a device: Click Link a device. In the dialog box, enter a Datto RMM or Datto Continuity device name and the search results will be narrowed as you type. Note that the search is performed in the same site that the Managed Power device is associated with. Select a device and click Link. Make sure that you select the correct device that's plugged in to the port. The linked device will now be displayed in the table under the Device column. To unlink a device: Click Unlink device to remove the linkage between the Datto RMM or Datto Continuity device and the Managed Power port. |
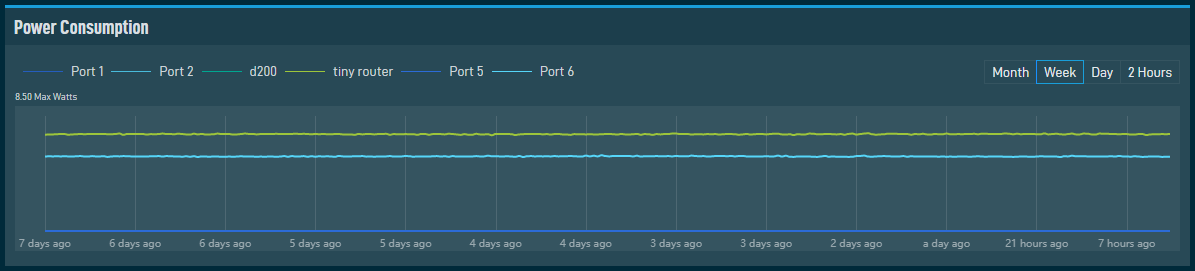
The Power Consumption card displays a graph for the device's power consumption (Watts) on each port. You can choose one of the following views: Month, Week (selected by default), Day, 2 Hours.
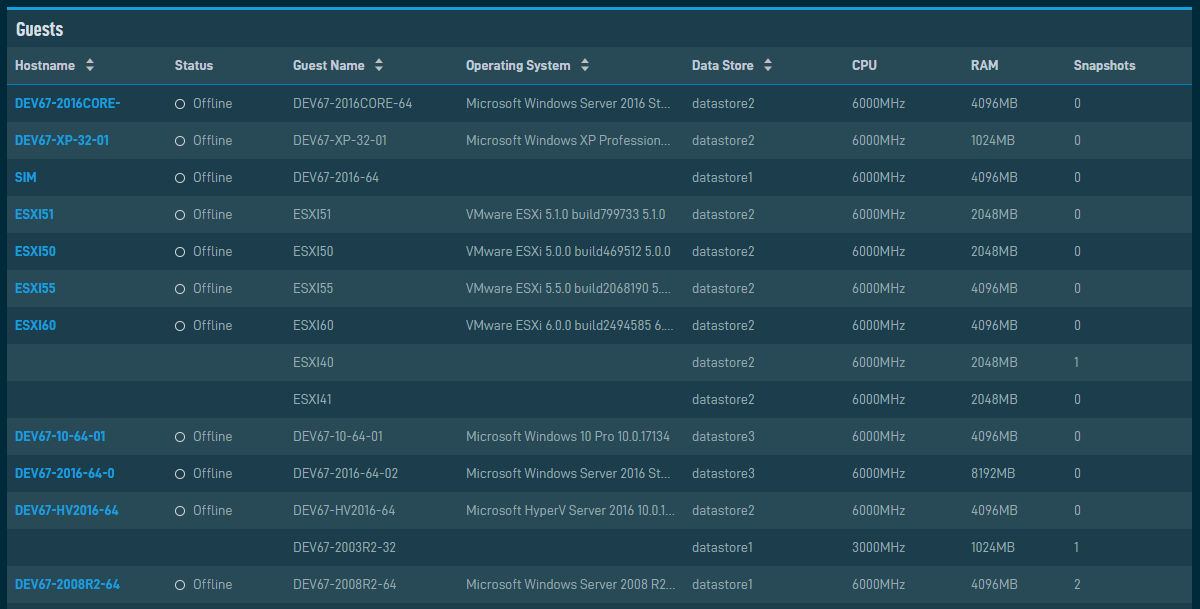
The Guests card contains the following information:
| Column | Sortable? | Note |
|---|---|---|
| Hostname |
|
Click the hyperlink to open the virtual machine's Device Summary page. No hyperlink is displayed for devices that are not added to Datto RMM. |
| Status | ||
| Guest Name |
|
|
| Operating System |
|
|
| Data Store |
|
|
| CPU | ||
| RAM | ||
| Snapshots |
NOTE Limited information is displayed if the virtual machine doesn't have a Datto RMM Agent installed.


