Widget Library
SECURITY Refer to ACCOUNT > Dashboard in Security Level Details - Permissions
NAVIGATION New UI > Dashboards > Add a Widget
IMPORTANT Datto RMM Dashboards are available within the New UI tab for all partners to access if Dashboard permissions are enabled (refer to Security Level Details - Permissions). If you have suggestions or comments, please submit your feedback via the Send Feedback button. Your feedback will be sent directly to the development team. It will be used to improve the functionality of the dashboards and to prioritize new features.
Dashboards display data widgets, which are graphical interface elements that visualize and summarize information about the data in Datto RMM. In some cases, clicking on, or drilling into, a graphical element opens a table grid containing the underlying data. Clicking the X returns you to the main display for the widget. You can also click on an individual record to open that record in the Web Portal. Refer to The Datto RMM Web Portal.
NOTE Widgets are not clickable or editable in full-screen mode.
Widget Types
NOTE Any site filters applied will constrain the result sets for the widgets. Refer to Dashboards Settings.
The following widget types are currently available from the Widget Library:
| Name | Type | Description | Widget Settings |
|---|---|---|---|
Device Filter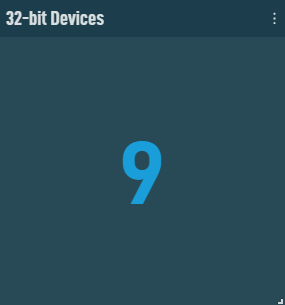 |
Statistics | Shows the number of devices targeted by this device filter. If the number is at least one, clicking on the number in the widget allows you to drill down into a list of targeted devices. If no results are returned within 30 seconds, the widget will display no results and an error message will display. | A threshold can be configured above which the value will change color from blue to red. You may also change which device filter this widget displays information about by entering the name of the device filter in the text box. The search results are narrowed as you type. |
Offline Devices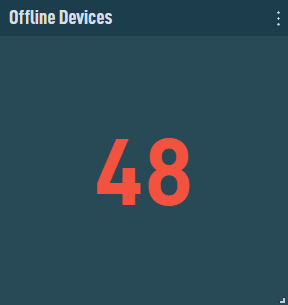 |
Statistics | Shows the number of offline devices. Clicking on the number in the widget allows you to drill down into a list of the offline devices. |
A threshold can be configured above which the value will change color. You may also select the device types to display. NOTE OnDemand devices will not be included in this widget. |
Offline Devices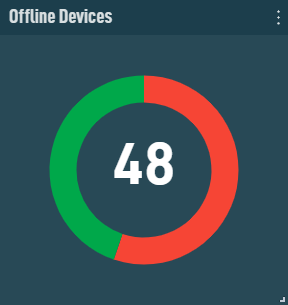 |
Doughnut | Shows the number of offline devices. Clicking on a section of the doughnut allows you to drill down into a list of either the online or the offline devices. | N/A |
Offline Devices by Device Type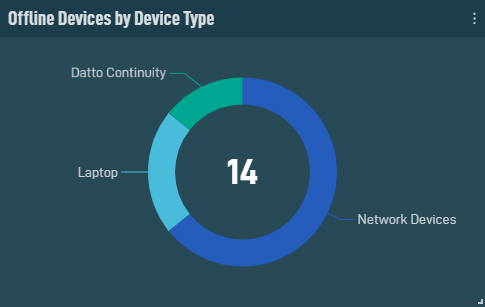 |
Doughnut | Shows the number of offline devices by Device Type. Clicking on a section of the doughnut allows you to drill down into a list of offline devices of the same device type. |
Select the recency of offline devices to display, the device types, and whether or not to display device type labels. |
Offline Devices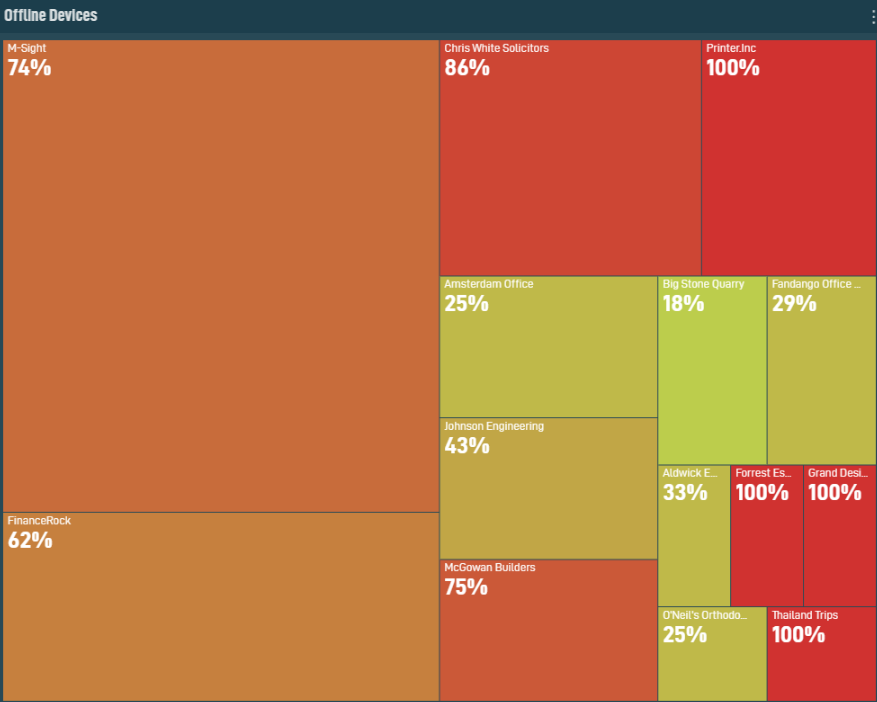 |
Tree Map | Shows a tree map of offline devices. Each rectangle represents a site's offline devices. The size of the rectangle represents the number of devices in a site that are offline, and the color represents how many devices have gone offline in the configured period as a proportion of all devices. Clicking on a site in widget allows you to drill down into a list of the offline devices for that site. |
Select the recency of offline devices to display, enter a site limit, and select the device types. |
Offline Devices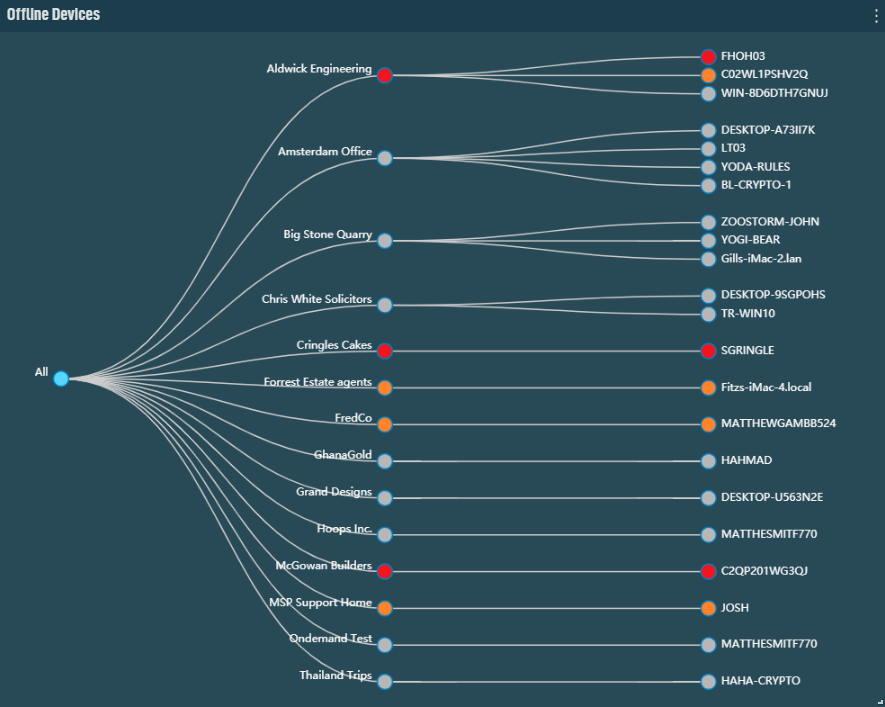 |
Tree | Shows a tree of offline devices. The color of the node provides an indication of how recently the device went offline: red means the device went offline within the past 30 mins;
orange means the device went offline within the past 12 hours;
gray means the device has been offline for longer than 12 hrs. Hovering over the root node shows the count of child sites that have offline devices.
Hovering over the site node shows the count of offline devices within the site. Clicking on the site or device nodes allows you to drill down into individual sites or individual devices in the Datto RMM Web Portal. Clicking on the root note collapses the tree structure. |
Select the recency of offline devices to display, enter a device limit, and select the device types to display. |
Recent Offline Devices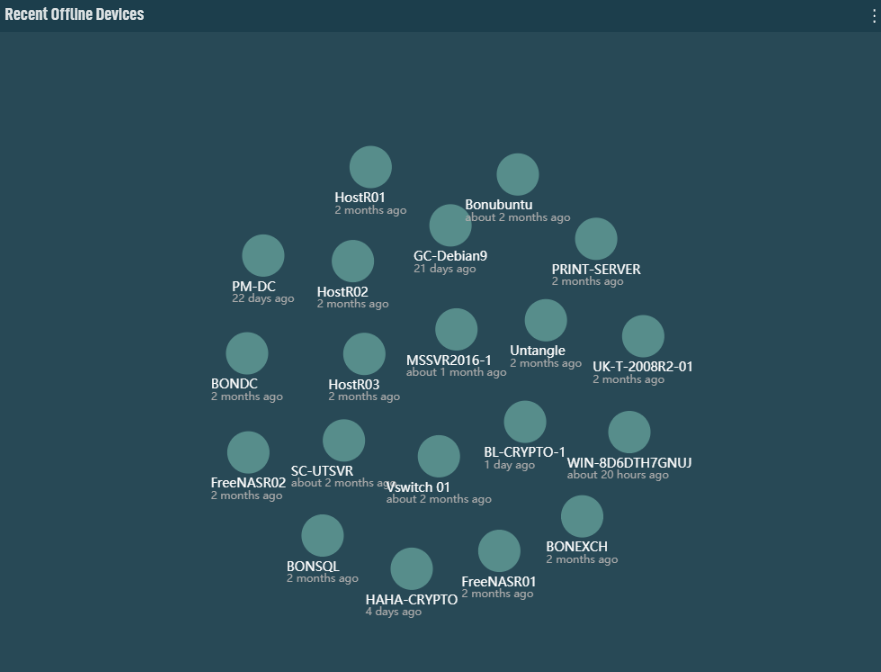 |
Graph Force | Shows a graph force representation of offline devices. Recently offline devices are represented as larger dots. | N/A |
Windows Patch Status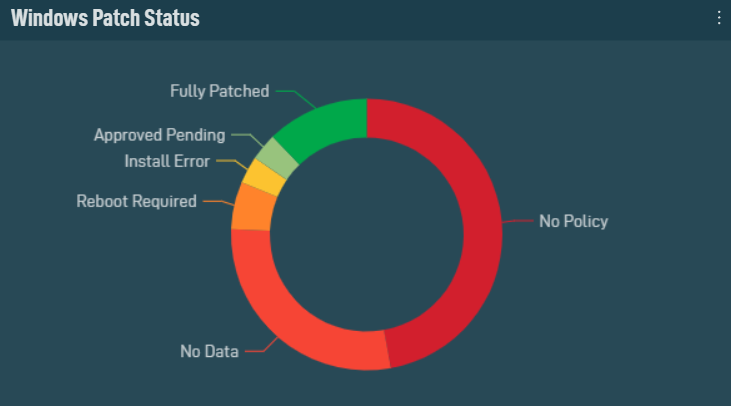 |
Doughnut | Shows a breakdown of Windows device patch statuses. The color of the doughnut section provides an indication of the patch status for those devices: • Green - Fully Patched Clicking on a section of the doughnut allows you to drill down into a list of devices with the same patch status. |
N/A |
Antivirus Status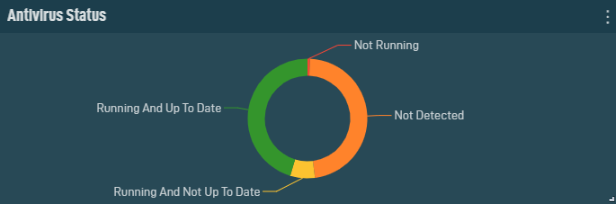 |
Doughnut | Shows a breakdown of antivirus status. Clicking on a section of the doughnut allows you to drill down into a list of devices with the same antivirus status. The color of the doughnut section provides an indication of the antivirus status for those devices: • Green - Running And Up To Date |
N/A |
Notes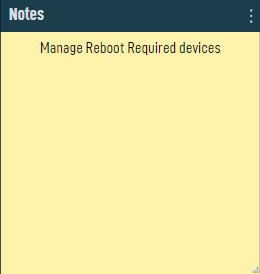 |
Text | Enter and save custom notes. | N/A |
Clock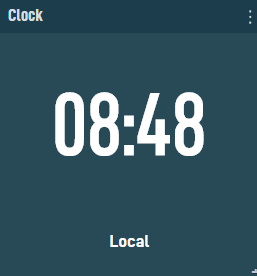 |
Clock | Displays the current time. |
Select a timezone and whether or not to display the timezone label. |
Alerts by Category (Open)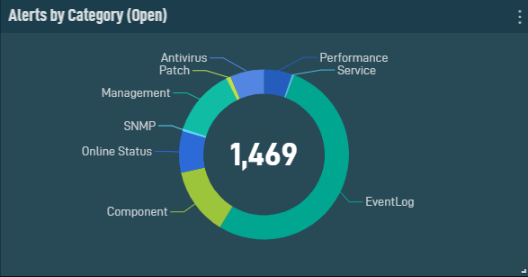 |
Doughnut | Shows a breakdown of the number of open alerts. Clicking on a section of the doughnut allows you to drill down into a list of alerts of the same category. From this list, you can resolve one or more alerts. You can also export all or selected rows to CSV. Refer to Open Alerts. | Select the recency of alerts to display and the alert categories. |
Alerts by Priority (Open)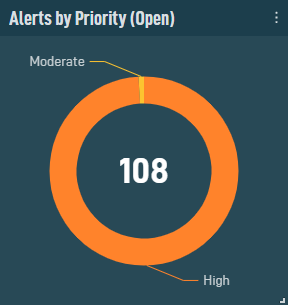 |
Doughnut | Shows a breakdown of the number of open alerts by priority. Clicking on a section of the doughnut allows you to drill down into a list of alerts with the same priority type. From this list, you can resolve one or more alerts. You can also export all or selected rows to CSV. Refer to Open Alerts. | Select the recency of alerts to display and the alert priorities. |
Recent Alerts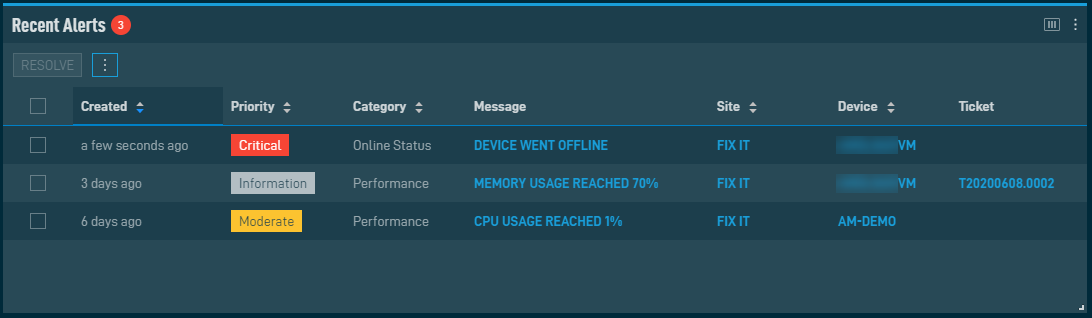 |
Table | Shows a tabular view of open alerts. The table header has a badge showing the number of alerts, and the color of the badge matches the color of the highest priority alert in the list. From this list, you can resolve one or more alerts. You can also export all or selected rows to CSV. Refer to Open Alerts. |
The Column Chooser allows you to select which columns should be visible in the list. Refer to Column Chooser field definitions for descriptions of all of the available fields. From the Widget Settings, select the recency of alerts to display, the display priorities, which audible alerts will play a sound when an alert is raised, and the category of the alerts. NOTE In the Audible Alerts section, select the check box next to each alert type to test the sound played for that alert. These sounds are not currently customizable. By default, all sounds are turned off when adding a new widget. |
Software Management Status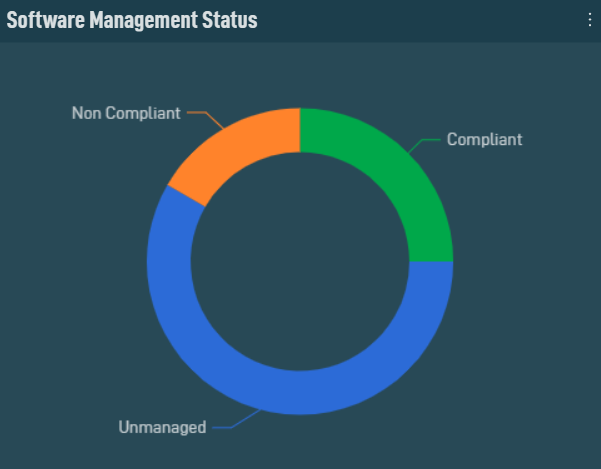 |
Doughnut | Shows a breakdown of software management status. The color of the doughnut section provides an indication of the patch status for those devices: • Green - Compliant Clicking on a section of the doughnut allows you to drill down into a list of devices within their respective sites and the software management status for each device. |
N/A |
Text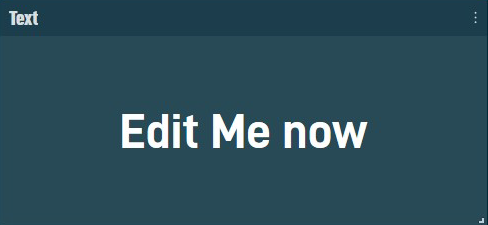 |
Text | Enter and save custom text, including the title of the widget. In full-screen mode, text editing will not be available, and the title will be hidden. | N/A |
IFrame |
IFrame | Enter a secure (https://) URL and press Enter to view the embedded content. The inline frame automatically updates when the text box loses focus or enters full-screen mode. If a non-secure URL is entered, a message will display indicating that the URL must be secure. | N/A |
Datto Continuity Devices Local Storage Consumption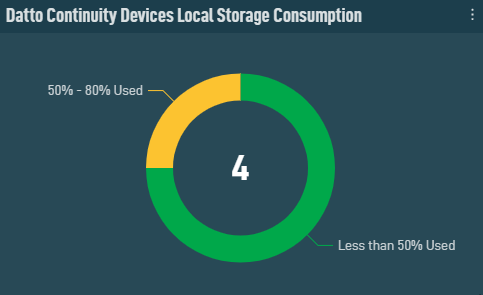 |
Doughnut | Shows the percentage of local storage used for each Datto Continuity device. The color of the doughnut section provides an indication of the storage percentage used for those devices: green means 0-50% has been used; amber means 80% has been used; red means over 80% has been used. Clicking on a section of the doughnut allows you to drill down into the widget to view the list of those devices with the following sortable columns: Hostname, Site, Local Storage Used, and Local Storage Available. | N/A |
Datto Continuity Backup Status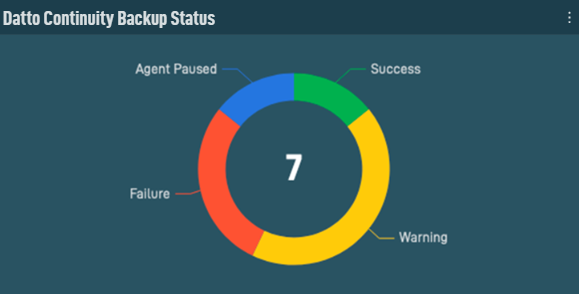 |
Doughnut | Shows the status of the latest backups taken of protected devices. The color of the doughnut section provides an indication of the backup status: green means the backup was successful; amber means the backup completed with warnings or errors, red means the backup failed, and blue means the Datto RMM Agent is paused on the protected device. Clicking on a section of the doughnut allows you to drill down into the widget to view the list of protected devices with the following columns: Hostname, Device (links to the Datto Continuity device protecting this device), Site, Last 10 Backups, Local Backup, Offsite Sync, and Screenshot Verification. All columns are sortable except for Last 10 Backups. | N/A |
Devices Under Maintenance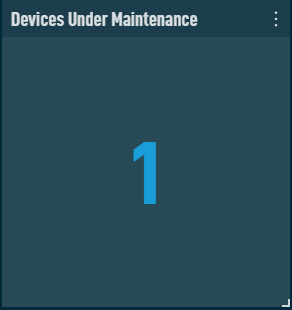 |
Statistics | Shows the number of devices currently in maintenance due to a Maintenance policy or unscheduled maintenance. Refer to Maintenance policy and Create a Maintenance Mode Window. Clicking on the number in the widget allows you to drill down into a list of devices in maintenance. |
N/A |
Open the Widget Library by clicking the Add a Widget button. Observe that the Widget Library opens.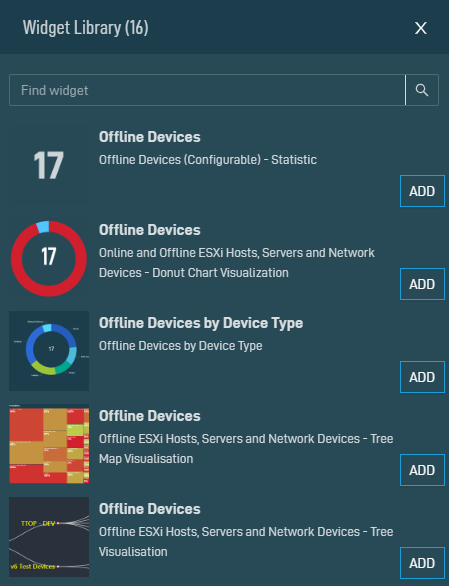
You may search for widgets by using the search bar at the top of the Widget Library.
Click Add to add a widget from the Widget Library to your dashboard. Once added to your dashboard, you can click and drag widgets to resize and rearrange them.
NOTE If a widget has already been added to your dashboard, a check mark appears next to the widget. However, you can add the same widget type multiple times.
To access widget settings, click the Widget Settings icon in the top right corner of the widget.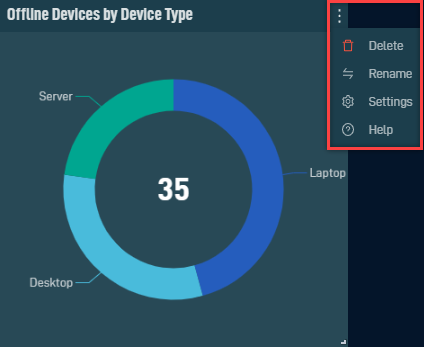
| Field | Description |
|---|---|
| Delete | Click Delete to remove this widget from the current dashboard. |
| Rename | Click Rename to make the name field for this widget editable. Enter the new name for the widget and hit Enter. You can also rename a widget by clicking on the text at the top of the widget and entering a new name. The changes will be saved automatically. |
| Settings | Click Settings to access settings that are specific to this widget type, if applicable. When you have finished configuring the widget, click Save to save your changes. NOTE Not all widgets have configurable settings. Refer to Widget Types. |
| Help | Click Help to access the Datto RMM Help. |


