The job view
SECURITY Refer to JOBS in Security Level Details - Permissions
NAVIGATION Jobs > Active Jobs > click the name of a job
NAVIGATION Jobs > Completed Jobs > click the name of a job
NAVIGATION Account > Monitor > Job Alerts radio button > click the name of a job (with Administrator security level)
About the Job View page
You can access information about individual jobs and their results both from the Active Jobs and Completed Jobs pages, and the Account > Monitor > Job Alerts page by clicking the name of the job. You are then directed to the Job View page.
IMPORTANT You must have Administrator security level to access the Account > Monitor > Job Alerts page.
On the Job View page, each device targeted by the job is displayed in a separate row.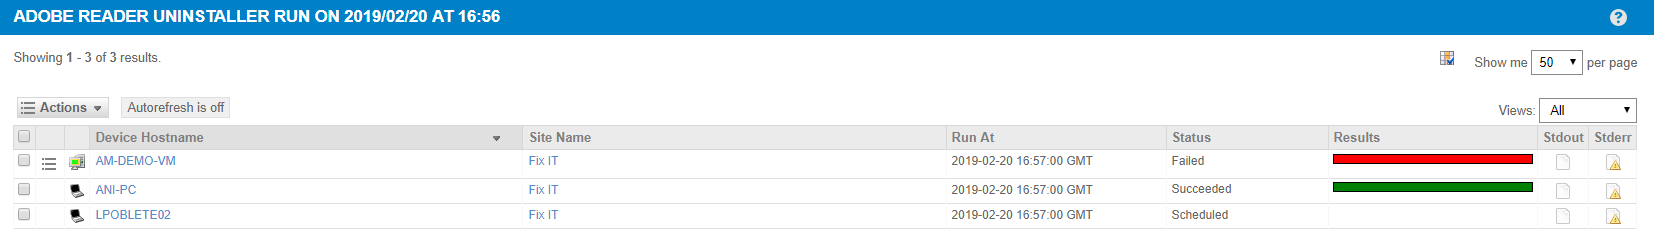
Views and actions
| Field | Description |
|---|---|
 Column Chooser Column Chooser |
The Column Chooser allows you to select which columns should be visible in the list. Refer to Column Chooser field definitions for descriptions of all of the available fields. |
| Show me 25 / 50 / 100 per page | Select to show 25 / 50 / 100 entries per page. 50 is selected by default. |
 Actions Actions |
Select any device, then hover over the Actions menu, and select one of the following actions: •  Add device(s) to group - Add the selected device(s) to a group. Refer to Groups. Add device(s) to group - Add the selected device(s) to a group. Refer to Groups.•  Rerun job on selected devices - Select this action when the job succeeded on some devices but not on others. Rerun job on selected devices - Select this action when the job succeeded on some devices but not on others.• Schedule a job - Refer to Job scheduler.• Run a quick job - Refer to Quick jobs.•  Download selected Standard Output/Error - Launches a window that lets you configure the download options for the Standard Output / Error messages, such as file format, and how you want to receive the file. Download selected Standard Output/Error - Launches a window that lets you configure the download options for the Standard Output / Error messages, such as file format, and how you want to receive the file.•  Resend run job message - Select this action when a device is online, but the job appears to be stuck at the scheduled status. This will resend the message that a job needs to be run. Resend run job message - Select this action when a device is online, but the job appears to be stuck at the scheduled status. This will resend the message that a job needs to be run.•  Export to CSV - Allows you to export a list of the selected devices in .CSV format. Make sure to select/deselect the columns you want to include/exclude in the export. Export to CSV - Allows you to export a list of the selected devices in .CSV format. Make sure to select/deselect the columns you want to include/exclude in the export.NOTE Microsoft Excel is unable to properly display UTF-8 compliant CSV files when they contain non-English characters. • Refresh - Click to refresh the results. Refresh - Click to refresh the results. |
| Auto-refresh is off/on | By default, auto-refresh is set to OFF. Auto-refresh only happens when an action occurs to trigger it. It does not refresh at set time intervals. Click to switch it on or off. |
| Views | Select one of the following options: • All - Selected by default. It shows all job alerts. • Scheduled • Running • Succeeded • Warnings • Failed • Expired |
Columns
| Field | Description |
|---|---|
| Selection check box | Check to select any of the devices. |
|
Context menu |
Hover over the context menu and select any of the remote actions. Refer to Remote Actions. |
| Device status icon | Shows the online / offline status, privacy status and Network Node status of the device. |
| Device Hostname | The name of the device. Click the hyperlink to open the Device Summary page. Refer to Device Summary. Click the column header to sort by this column. |
| Site Name | The name of the site that the device is associated with. Click the hyperlink to open the Site Summary page. Refer to Site Summary. Click the column header to sort by this column. |
| Run At | Date, time, and time zone when the job was run. |
| Status | The current status of the job on the device. The job may have succeeded on some devices, and expired or failed on others. You can filter expired or failed devices and select the Rerun job on selected devices action. |
| Results | A color indicator of the job result. Green - The job ran successfully. Orange - The job ran but there was a standard output (Stdout) value found based on the component's post-conditions warning text filter. Refer to Post-Conditions. Red - The job failed. |
Stdout  Stderr  |
Click one of the icons to view the Stdout (standard output) or Stderr (standard error) message for the device. In the pop-up window, click Download results to download the file. The results are available to download within three months. NOTE Stdout and Stderr are also logged in the service logs found in C:\Program Files (x86)\CentraStage\log.txt for both quick or scheduled jobs, as well as in %ProgramData%\CentraStage\AEMAgent\DataLog\ for jobs run as a monitor response. NOTE You can also download the job output file from within an email notification if the job was configured to send an email. Refer to Job scheduler. |


