Manage alerts
SECURITY Refer to ACCOUNT > Monitor and SITES > Monitor in Security Level Details - Permissions
NAVIGATION Account > Monitor > Monitor Alerts
NAVIGATION Sites > select a site > Monitor
NAVIGATION Device > select a device > Monitor > Monitor Alerts
What is an alert?
An alert is the automatic response to a device operating outside of the parameters defined in a monitor. Alerts appear and can be managed on the Monitor tab at the account, site, and device levels, where you can review them and take the appropriate action. Automatic response options include running a component, sending an email to designated recipients, and creating a ticket.
About the Monitor Alerts page
The Account > Monitor tab displays radio buttons that allow you to toggle between Monitor Alerts and Job Alerts lists. For information about Job Alerts, refer to Job alerts.
The Site > Monitor tab displays Monitor Alerts only.
The Device > Monitor tab displays radio buttons that allow you to toggle between Monitor Alerts and Monitors. For information about Monitors, refer to Monitors and policies.
| Field | Description |
|---|---|
| Selection box | Check to select one or multiple alerts. You can perform actions on those alerts once selected. Refer to Action bar icons. |
Column Chooser  |
The Column Chooser allows you to select which columns should be visible in the list. Refer to Column Chooser field definitions for descriptions of all of the available fields. |
| Category | By default, alerts of all categories are shown. Click the drop-down to display alerts from a specific monitor category. For more information about monitor categories, refer to Monitor types and categories. |
| Priority | By default, alerts of all priorities are shown. Click the drop-down to display alerts of a specific priority: • Critical (Priority 1) • High (Priority 2) • Moderate (Priority 3) • Low (Priority 4) • Information (Priority 5) |
| Status | By default, only Open Alerts are shown. Click the drop-down to display alerts with a specific status: • Open Alerts • All Alerts • Resolved Alerts |
| Search | Enter any text and click Search to narrow the results. NOTE An alert consists of many different variables rather than a single message, therefore, the search is performed in a number of alert fields. Not all alert fields are currently supported but more will be added over time. |
| Icon | Name | Description |
|---|---|---|

|
Resolve selected alerts | Manually sets the status of the selected alerts to Resolved. Standalone ticketing: If your alert raised a ticket, resolving the alert will add a ticket note to the ticket and close the ticket. You may disable the auto-resolution of tickets in the monitor's Ticket Details section in the current UI (refer to Create a monitor) or in the alert details section in the New UI (refer to Alert details per monitor type). Integrated ticketing: If you use integrated ticketing with Autotask PSA, enabling self-healed and cleared alerts will allow you to handle the corresponding PSA alert ticket's status. Refer to Self-Healed and Cleared Alerts. |

|
Disable Monitor(s) for Devices | Disables the monitor at the device level. |

|
Export to CSV | Allows you to export a list of the selected alerts in .CSV format. Make sure to select/deselect the columns you want to include/exclude in the export. NOTE Microsoft Excel is unable to properly display UTF-8 compliant CSV files when they contain non-English characters. |

|
New Ticket | Click to create a ticket for the selected alert(s). Standalone ticketing: In the pop-up window, you can complete the following fields: Assigned To, Priority, Ticket Email Notification Integrated ticketing: The ticket(s) will automatically be created in your corresponding PSA, and the ticket number(s) will be displayed with a hyperlink on the Monitor Alerts page in the Datto RMM Web Portal. Click on the ticket number(s) to open the ticket(s) in your PSA. |

|
Schedule a job | Schedule a job for the device(s) that the selected alerts were created for. Refer to Job scheduler. NOTE At the device level, this action is only available in the Alert Information window. Refer to View and act on alert information. |

|
Run a quick job | Run a quick job on the device(s) that the selected alerts were created for. Refer to Quick jobs. NOTE At the device level, this action is only available in the Alert Information window. Refer to View and act on alert information. |

|
Refresh | Refreshes the current view. |
| Auto-refresh is on/off | Only available at the account level. By default, auto-refresh is set to ON. Auto-refresh only happens when an action occurs to trigger it. It does not refresh at set time intervals. Click to switch it on or off. |
The Column Chooser allows you to select which columns should be visible in the list. Refer to Column Chooser field definitions for descriptions of all of the available fields.
How to...
When you click on the alert message hyperlink, the Alert Information window is displayed.
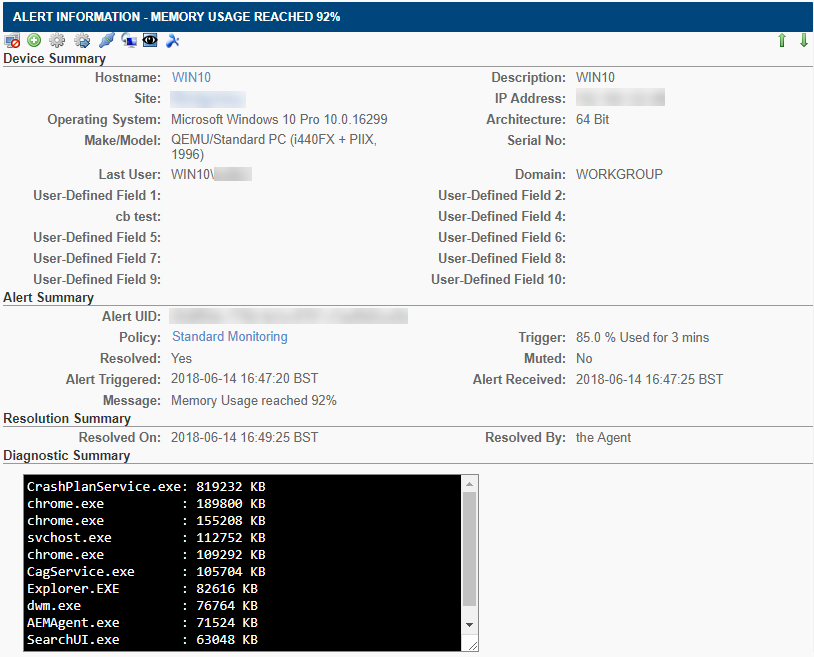
On this page, you will see the following information:
- Device Summary, with links to the device and the site
- Alert Summary, with links to the Policy that deployed the monitor that triggered the alert
- Alert Response if an automatic response was configured in the monitor, with links to created tickets
- Resolution Summary if the alert was resolved
- Diagnostic Summary (e.g. CPU/memory usage data or component monitor output)
NOTE To learn how to write diagnostic data in the output of an alert generated by a component monitor, refer to Create a custom component monitor.
Below the title bar, you will see a number of action icons that allow you to act on the information. Refer to Action bar icons.
You can also connect to some devices. Refer to Remote Actions.
To the right of the Action bar icons, you can click on the up and down arrows 
 to view the previous or next alert in the list without having to close the Alert Information window.


